Fantasy
11/21/23
9 min read
2023 NFL Week 11 High-Value Touch Report: Rushing and Receiving Data
We’re coming to the point in the season where every yard, touchdown and point matters in fantasy football. Injuries have devastated real-life and fantasy football teams, affecting some high-end offenses.
One of the tiebreakers I often use involves the success or efficiency of an offense. A simple way to do that involves the touchdown percentage of goal-to-go (GTG) drives but also includes the team's rush success rate because teams tend to run when close to the goal line.
The graphic below shows the team leaders in GTG efficiency or GTG touchdown percentage, but it’s important to consider the raw number of drives.
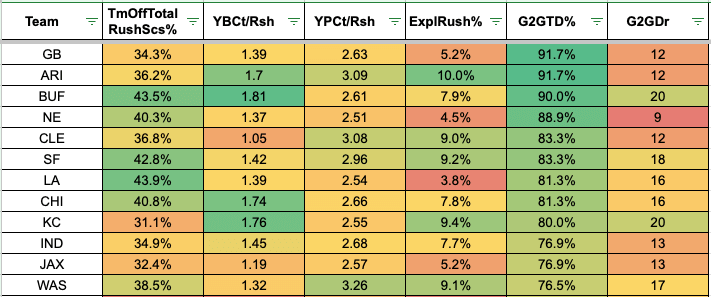
Among the leaders in GTG efficiency, the Buffalo Bills, San Francisco 49ers, Los Angeles Rams, Chicago Bears, Kansas City Chiefs and Washington Commanders have 15 or more drives.
The percentage for the Green Bay Packers, Arizona Cardinals and New England Patriots might fool us at first glance — it doesn’t mean to avoid teams struggling to have GTG opportunities, but consider it’s a lower likelihood for James Conner, Rhamondre Stevenson and insert Packers running back.
Below, we’ll examine red zone (GTG) touches and opportunities. The context for these touches is important, so we’ll consider the potential game script that led to the usage. This information helps identify which players might be on the verge of scoring more touchdowns and fantasy points — and which players aren’t.
Given the small sample size, we sometimes find that players don’t regress quickly or that the data becomes more noisy than meaningful. The information will be broken down by red zone and GTG rushing and receiving data to find usage patterns and expected fantasy points.
Examining the Rams, Vikings' Backfields
Royce Freeman led Week 11 with six red zone rushing attempts and looked like the most explosive back on the Rams. Darrell Henderson garnered two red zone carries, with six total carries (for one yard) in Week 11. Freeman had a season-high 63 percent rush share (No. 9) compared with Henderson at 22.2 percent, plus Freeman had better advanced metrics.
He boasted a solid two yards before contact per attempt (YBC/Att) and 2.3 yards after contact per attempt (YAC/Att). With Kyren Williams expected back in Week 12, Freeman gained ground on Henderson as the primary backup.
After concerns about Alexander Mattison missing Week 11 due to a concussion, he and Ty Chandler came out to combine for more than 150 rushing yards. Mattison had five red zone attempts, while Joshua Dobbs and Chandler had one.
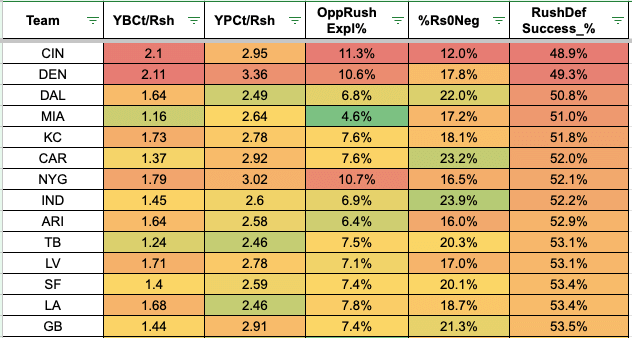
The Denver Broncos have the second-worst defensive rush success rate behind the Cincinnati Bengals, and the Broncos have also allowed the third-highest rate of explosive plays. The Minnesota Vikings running backs took advantage of the weaker run defense.
Mattison fought for yards after contact, evidenced by his 3.6 YAC/Att and 50 percent rush share. Chandler showed more balanced metrics with 2.9 YAC/Att and 5.1 YBC/Att, though he took a fake punt for 31 yards, which factors into those averages.
Dobbs looked more erratic against a tougher Broncos pass defense that has allowed the seventh-lowest passer rating since Week 6. That said, the Vikings have become more balanced. They have a 50 percent pass rate (No. 26) in Weeks 10-11 with Dobbs at quarterback — compared with the third-highest pass rate at 65.3 percent in Weeks 1-9.
We'll slightly upgrade Mattison and Chandler, pushing them into the backend RB2 range.
Red Zone Rushing
A pair of quarterbacks and running backs had four red zone rush attempts, including Gus Edwards, Lamar Jackson, Trevor Lawrence and Travis Etienne. We'll cover the Jacksonville Jaguars players later in the GTG rushing section, but let's examine the Baltimore Ravens. The visual below shows the red zone rushing leaders and touchdowns.
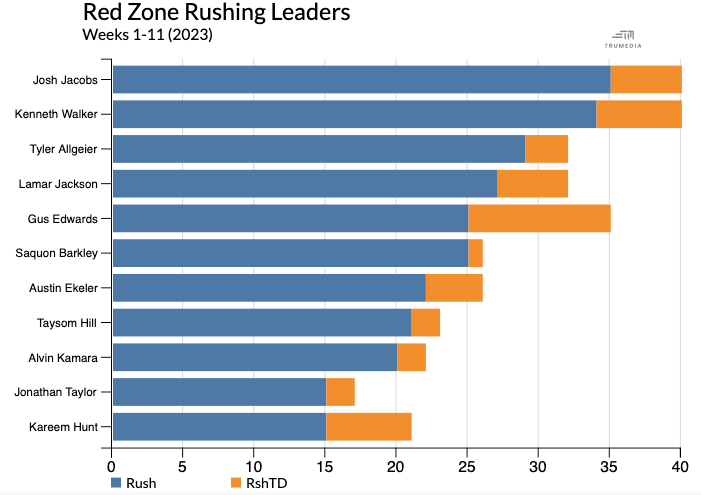
Edwards scored twice in Week 11, with both carries and touchdowns coming in GTG situations. Meanwhile, Jackson needs to catch up on the rushing scores. Since Week 8, Edwards has led the league with 15 red zone rush attempts, tied with Javonte Williams.
Edwards scored on eight of his red zone rushes, and Jackson scored on zero of his nine carries. Eventually, the rushing touchdown regression should shift in Jackson or another player's favor. However, Edwards has succeeded in needing the fewest red zone carries per rushing touchdown (at 1.9) since Week 8.
Monday, Isiah Pacheco had four red zone carries and dominated the backfield rush share at 63.3 percent (No. 9). Pacheco struggled to create yards before contact, evidenced by his season-long 1.4 YBC/Att. Against the Philadelphia Eagles, Pacheco posted a YBC/Att north of two for the second time this season, paired with a solid YAC/Att at 2.88 (No. 24).
After 17 red zone rushing attempts in Weeks 1-5, Pacheco has eight in the past five games. On the season, Kansas City ranks 26th in red zone rush rate and has the seventh-highest pass rate, suggesting Pacheco’s opportunities could be limited. Thankfully, Pacheco earns a healthy rush share, and the Chiefs hardly mix in another running back. Patrick Mahomes is second on the team with an 18.8 percent rush share.
Red Zone Receiving
Except for Nico Collins, the top five receivers with three or more red zone targets in Week 11 all scored. Keenan Allen, Collins and Amon-Ra St. Brown tied with four. Mike Evans (3) and Puka Nacua (3) rounded out the top five.
Baker Mayfield fed Evans the ball (12 targets) for a 26.7 percent share, yet Evans finished with just five receptions for 43 receiving yards.
Though Tank Dell continued to gain attention, and rightfully so, Collins returned and nearly matched him in target share (28.9 percent vs. 26.3 percent). Dell didn't garner a red zone target in Week 11. In the red area, C.J. Stroud has spread the ball evenly among Collins (7), Dalton Schultz (6) and Dell (6) since Week 6.
Noah Brown missed Week 11 after a couple of blowup performances and, hopefully, doesn't eat into the opportunities for Collins with Dell establishing a high-end WR2 role. Week 11 was yet another week where the Houston Texans dominated the red zone.
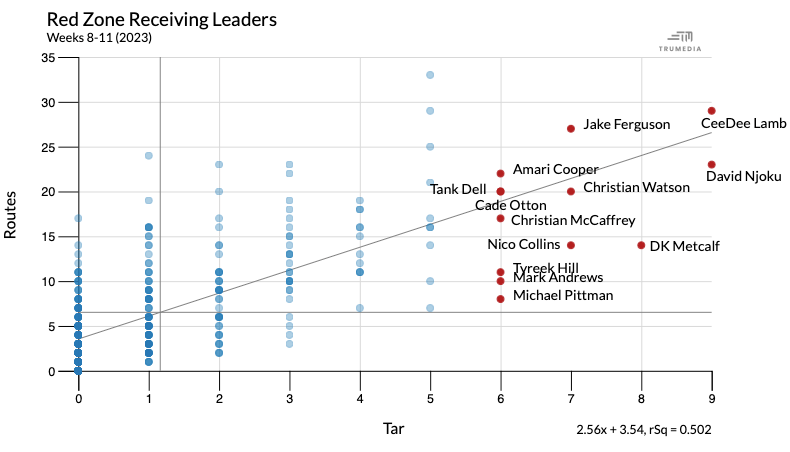
The visual above shows the red zone target leaders since Week 8. David Njoku and CeeDee Lamb lead the group with nine, and DK Metcalf sits in third. Collins, Jake Ferguson and Christian Watson tied for fourth with seven red zone opportunities. I mentioned Metcalf, with his red zone role, as a player to buy two weeks ago.
That's also evident in the graphic above because Metcalf finally caught one of his red zone opportunities, which came in a GTG situation for a touchdown. If your fantasy trade deadline hasn't passed, acquire Metcalf with the sixth-best remaining strength of schedule.
We've noticed a similar trend with Watson, who snagged a red zone target in Week 11 for the first time since Week 8. I discussed Watson last week as a dynasty buy, given his similar role from the boom rookie season.
Unfortunately, his volume isn't anything to write home about. He only had four targets (10 percent share). The target average in the Packers' offense seems to be around six. Romeo Doubs, Jayden Reed and Luke Musgrave all garnered that many. Watson ran the most routes (36), slightly ahead of Reed (36), Doubs (33) and Musgrave (32).
With Aaron Jones injured again, plus Green Bay's weak defense, the Packers might need to air it out. Since Week 8, the Packers rank 11th in pass rate (59.8 percent), similar to the season-long rate of 59 percent.
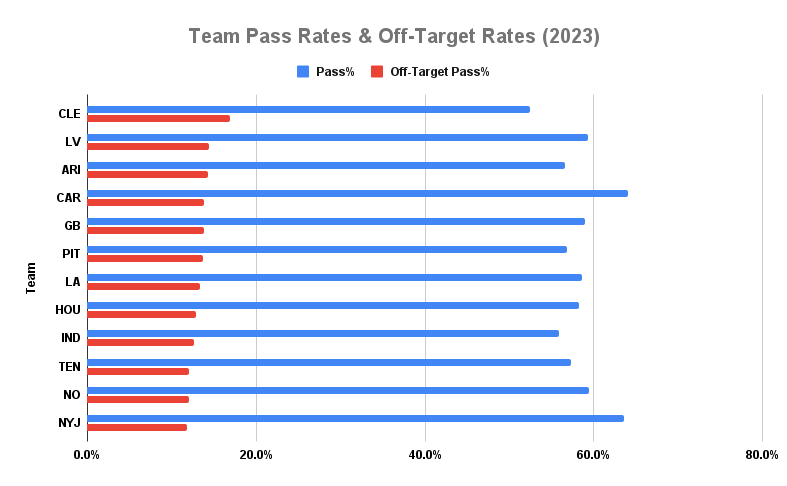
Off-target passes prevail as the primary issue for Jordan Love, who throws the fourth-most off-target passes at 13.8 percent, as seen in the graphic above. For context on how brutal it's been for Love. As a team, that's behind the Cardinals, Las Vegas Raiders and Cleveland Browns, while tying with the Carolina Panthers.
Circling back to Watson, he is one of Green Bay's top red zone options, though he isn't a high-end target earner otherwise. Hold and stash if you can in deeper formats.
Goal-to-Go Rushing
As noted earlier, Edwards kept stealing high-value touches for touchdowns from Jackson. Meanwhile, Lawrence ran in two of his four GTG carries in Week 11, and Etienne didn't receive a GTG rushing attempt this week but scored touchdowns in three consecutive games in Weeks 5-7.
Interestingly, those are Etienne's only five GTG carries on the season, tied with Lawrence. That's unsurprising because the Jaguars rank 23rd with 13 GTG drives, meaning it's a small sample of opportunities.
With the Rams, the overall usage and underlying metrics for Freeman, plus the five GTG carries that indicate the high-value touch role, give us a new data point.
Henderson had been the more reliable option, but with Williams injured, Freeman received six GTG rushing attempts compared with Henderson's four. Williams ranked sixth in expected points per game (EP/G) and had solid efficiency with 2.2 fantasy points over expectation per game (FPOE/G). Freeman or Henderson could eat slightly into Williams' usage, especially in the first week or two he's back.
The visual below shows the leaders in GTG rushing attempts.
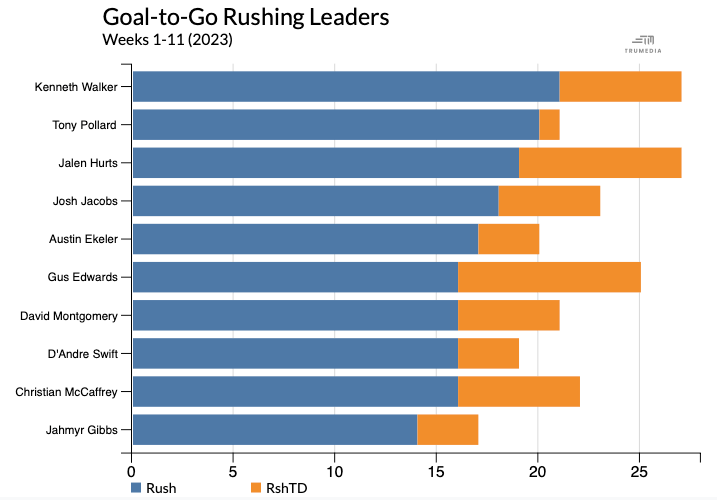
Let's talk about the Seattle Seahawks' backfield. Unfortunately, Kenneth Walker left the team's Week 11 game with an oblique injury, causing Zach Charbonnet to garner three GTG rushing attempts. That's notable because Walker had led the league with 21 GTG carries and has six rushing touchdowns.
That translates into the eighth-best rush-to-touchdown ratio among players with 10 or more GTG attempts. Charbonnet also had a 15.8 percent target share; he caught all six targets against the Rams. The rookie should have been rostered and stashed because of Walker's high-value touches on an above-average offense.
Goal-to-Go Receiving
Nacua led the small sample of pass catchers in GTG targets with three. Henderson, Lamb, Allen, Joe Mixon and St. Brown all had two GTG targets. With Cooper Kupp suffering an ankle injury, Nacua could return to the early-season elite-target earner role.
Since Kupp returned, Nacua ranked as a WR1 in two weeks but has three games as WR55 or worse. Nacua ranks as WR12 in Week 11, and we could see more high-end games from him if Kupp misses time.
Because teams typically run in GTG situations, we'll look back from Week 8 to see the leaders in targets: Lamb (5), T.J. Hockenson (4), Christian McCaffrey (4) and Ferguson (4).
Among pass catchers with three GTG targets since Week 8, Calvin Ridley, Njoku, Thielen and three Bengals players (Irv Smith, Mixon and Ja'Marr Chase) seem most notable. Unfortunately, Joe Burrow suffered a season-ending injury, causing the Bengals' offense to tank.
Follow The 33rd Team Podcast Network on Spotify and Apple Podcasts.