Fantasy
8/14/23
5 min read
Ultimate Guide to Second-Half Running Back Entries on Underdog Fantasy

In this installment of our series on second-half Underdog Fantasy entries, we will identify strategies for playing second-half lines for running backs. In the first installment on quarterbacks, we learned that game script is the most critical variable regarding second-half quarterback lines. Running backs are no different.
Below is a correlation table between first-half and second-half statistics:
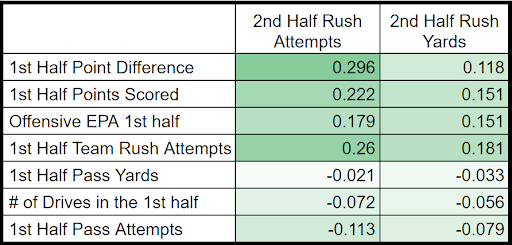
As it is more difficult to predict a running back’s second-half performance based on their performance in the first half, the data didn't lend itself as clearly to creating a reference table as was the case for quarterbacks. The correlations for running back statistics were less marked and evident than the quarterback statistics studied in our last entry.
However, there are still plenty of trends we can use to our advantage to win these second half-entries.
Rule No. 1: Focus on Rushing Attempts
There is a ton of noise to second-half rushing yard entries due to the sheer number of variables that go into rushing yards, so this analysis focuses on rushing attempts.
Rule No. 2: Use Game Script to Predict Attempts
One of the most challenging parts about looking at running back second-half entries is that all offenses are different. To account for those differences, we compared teams based on the difference in their passing attempt to rushing attempt ratios in the first and second half of games. These differences in first and second-half ratios were compared based on the score difference at halftime.
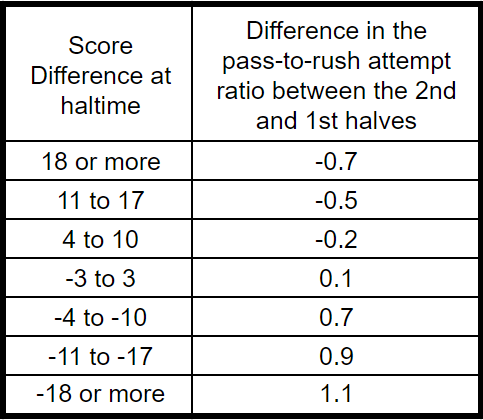
While you could do a lot of math to create predictions for the second half based on this table, it is better used as a quick reference to show you to what degree a team should go run-heavy.
For example, teams down 11 to 17 points at halftime saw their pass-to-rush ratio increase by 0.9. This means they saw a strong increase in passing attempts relative to rushing attempts. A team leading by 11 to 17 points saw their pass-to-rush ratio decrease by -0.5, which means they saw a strong increase in rushing attempts relative to passing attempts.
How does this kind of information help us understand what is going to happen on the field? Here's a real-world example:
The Cleveland Browns were down 17-10 to the Miami Dolphins in Week 10 last season. Nick Chubb’s rushing attempt line at the half was 7.0 rushes. The table says teams on average see an increase in pass-to-rush attempt ratio of 0.7 in that game script situation, so we should expect more passes relative to rushing attempts in the second half.
The Brown’s pass-to-run ratio in the first half was 1.0 as they had 14 passing attempts and 14 rushing attempts. We can use Jacoby Brissett’s 17.5 second-half passing attempts line on Underdog Fantasy to determine how many rushing attempts we expect the Browns to have in the second half. Assuming the Browns would see a 0.7 increase in their pass-to-rush ratio, their projected second-half ratio would be 1.7. If you divide one by the projected pass-to-run ratio and then multiply that by the number of projected second-half passing attempts, you get the projected number of second-half rushing attempts.
In this example, the math would look like this:
(1/1.7) x 17.5 projected passing attempts = 10.3 projected rushing attempts.
We can use that 10.3 rushing attempt number then to project Chubb’s rushing attempts. He had 43 percent of the team's rushes in that game's first half, so if we project that to the second half, we expect him to have 4.4 rushes. Based on this math, going lower on a rushing attempt line of seven is a good play.
The Browns ended up having a 2.1 pass-to-rush attempt ratio in the second half of that game and Chubb went lower than the line, with 5 rush attempts in the second half.
Rule No. 3: Exercise Caution on Lines That Project Increased Rushing Usage
Here are some fundamental trends for starting running backs with at least eight rushing attempts in a single game over the last two seasons:
With a lead of 10 points or more at halftime, only 31 percent of running backs in this sample saw an increase in carries in the second half.
When trailing 10 points or more at halftime, running backs in this sample saw an average decrease of 3.2 rushing attempts between the first and second half.
If the game is within 10 points at halftime, running backs in this sample see an average decrease of 2.0 rushing attempts between the first and second half, with 34 percent of running backs decreasing by two to five rushing attempts. Only 30 percent of running backs saw an increase in rushing attempts in the second half.
Conclusion
Running back second-half entries are messy, but we can use some trends to create second-half entries with the best possible potential. The easiest-to-identify trends are related to rushing attempts, as there are too many variables to feel confident about rushing yard entries.
With rushing attempt entries, most starting running backs with slightly above-average usage will see a decrease in rushing attempts in the second half, especially if the game is close or their team is trailing. As a result of this research, you should be more hesitant to play lines that project a player to increase their rushing attempts in the second half.
Watch for the next article as we dive into second-half entries for receivers.
Follow The 33rd Team Podcast Network on Spotify and Apple Podcasts.