Analysis
10/19/21
3 min read
CPOE Explained
Completion Percentage Over Expected (CPOE) has made noise in football discourse as the new advanced metric to measure QB play. Here we give an overview of the intuition behind CPOE, along with how it is calculated. We also explain some of the differences between popular CPOE models.
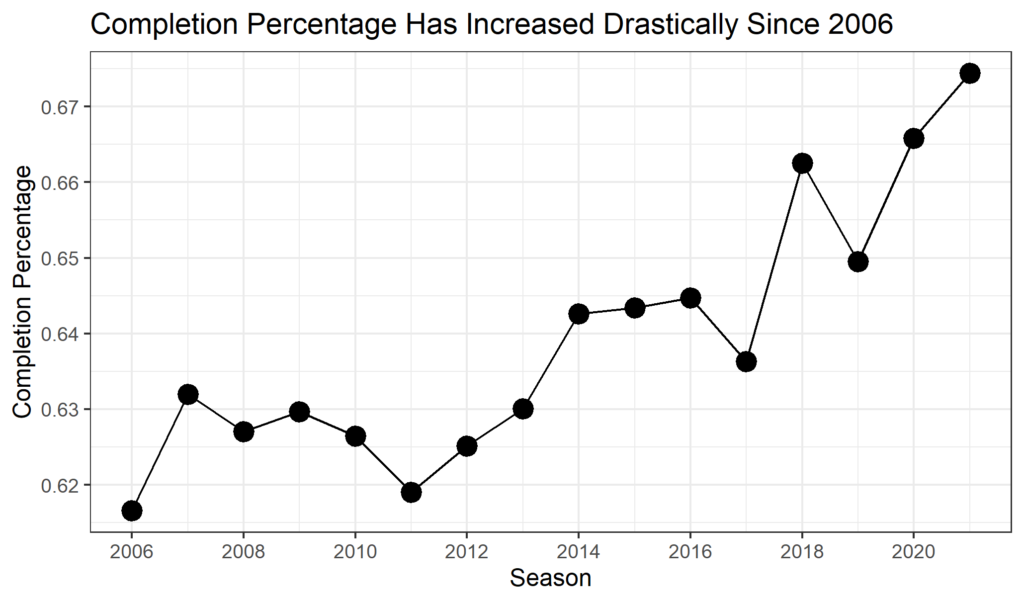
Not all completions and thus completion percentages are created equal. When Sam Bradford broke the previous season completion percentage record with a rate of 71.6% and an average depth of target of 6.4 yards, no one was arguing for him to get Pro Bowl consideration. Likewise, using completion percentage to compare among eras isn’t useful. In 1975, there were only four QBs with a Completion Percentage of over 60%, whereas in 2021 as of the writing of this article there are only three QBs with below a 60% completion rate. In 2018, passing offense and completion percentage significantly increased.
So, comparing raw completion percentage does not tell us much about a QB’s accuracy or performance. This is where we can use CPOE, which adjusts for contextual factors that make a pass more or less likely to be completed.
How is CPOE Calculated?
We can calculate the probability a pass will be completed using various predictors. The completion probability model by Ben Baldwin, which is used in NFLfastR, uses the following variables:
- Field position
- Down
- Yards to go
- Air yards
- Distance to sticks (air yards - yards to go)
- Whether possession team is at home
- Whether the game is played indoors
- Era, broken down into 2006-2013, 2014-2017, 2018 and beyond
- Pass location (binary: middle or not middle)
- Whether quarterback was hit on the play
For a more technical description of the model, click here.
So CPOE is simply: CPOE = Actual Completion % - Expected Completion %.
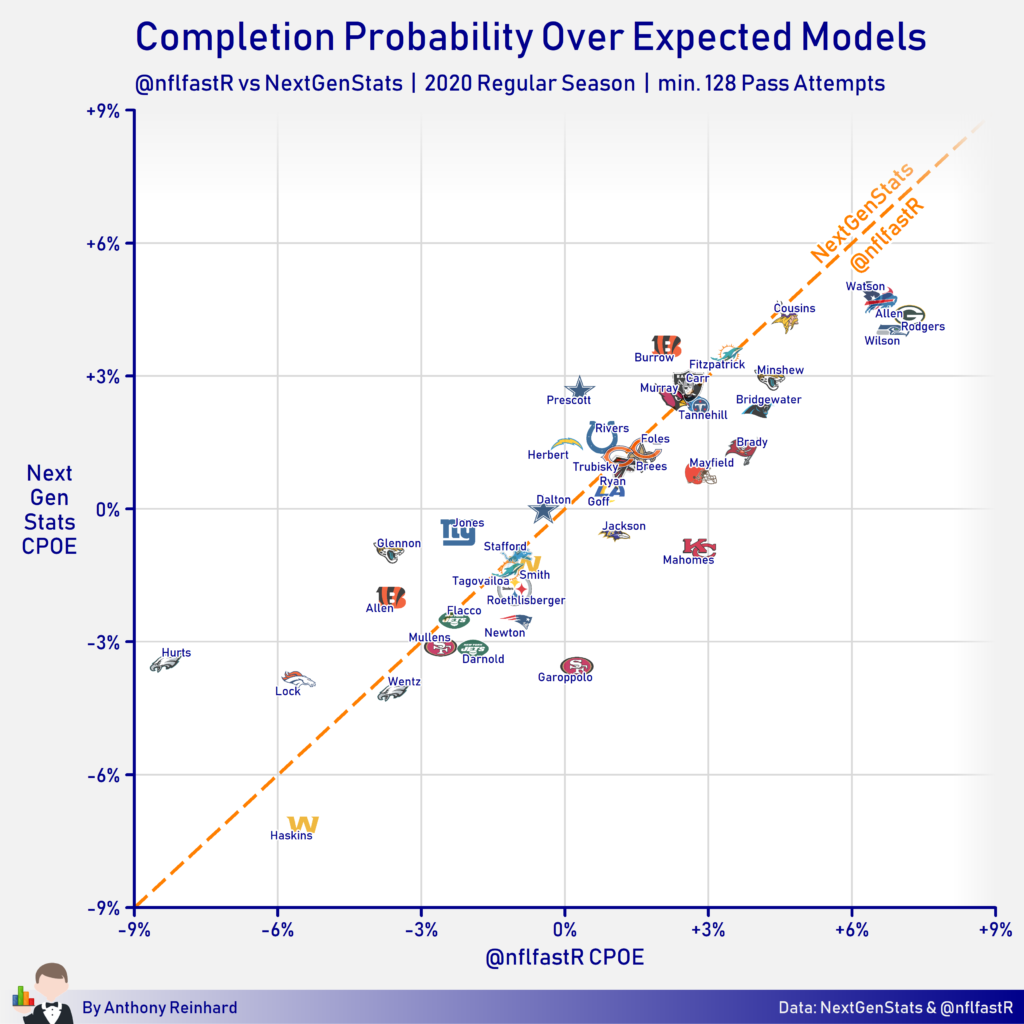
Where expected Completion % is calculated by finding the probability passes will be completed using a model like Baldwin’s. PFF and NFL Next Gen Stats both have their own CPOE models as well. Neither discloses their full model, but the key differences are that PFF utilizes their WR separation data and NFL Next Gen Stats is able to use tracking data to quantify things like how close defenders are to the QB, or how close DBs are to WRs, etc.
In theory, PFF and Next Gen Stats models have additional important variables to use that can better calculate true completion probability, but Baldwin’s model uses only publicly available data and the model’s perform very similarly.
A potential drawback of CPOE is that the quality of WRs targeted and their separation between defenders are significant factors in whether a pass is completed or not and these are not included in the public model. So CPOE is not a stat that can completely separate QB play from their surroundings, but it is a valuable stat that tells us much more about how accurate a QB is than raw Completion % alone.
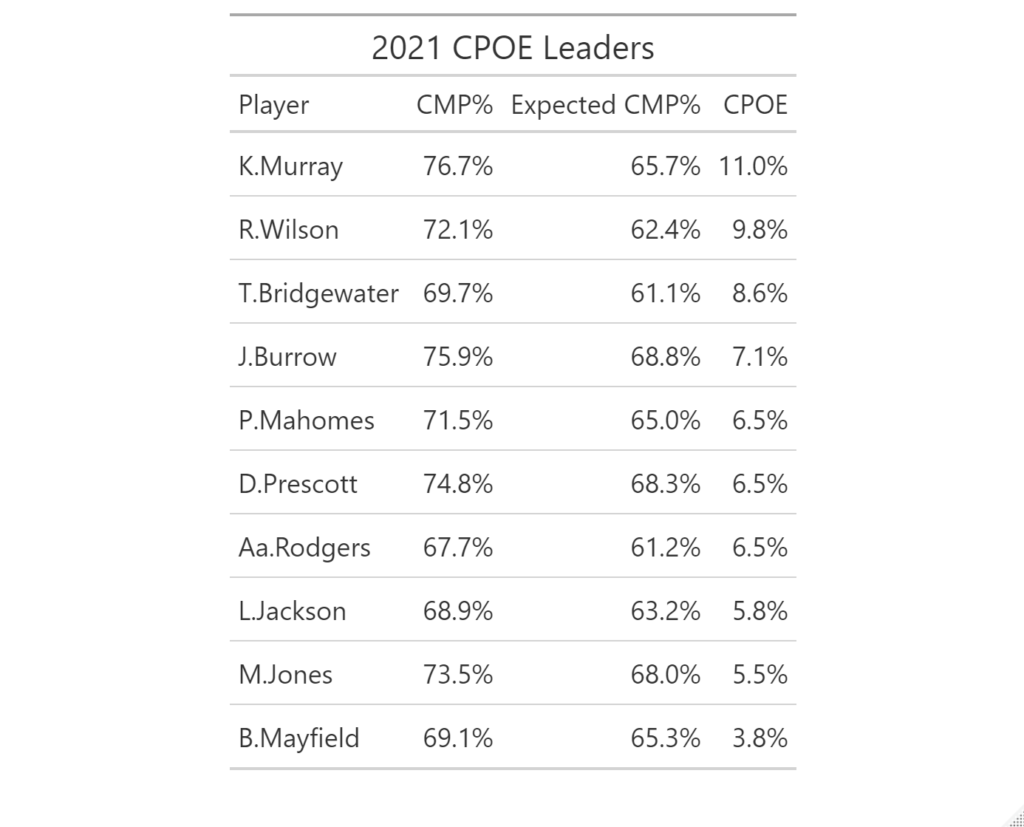
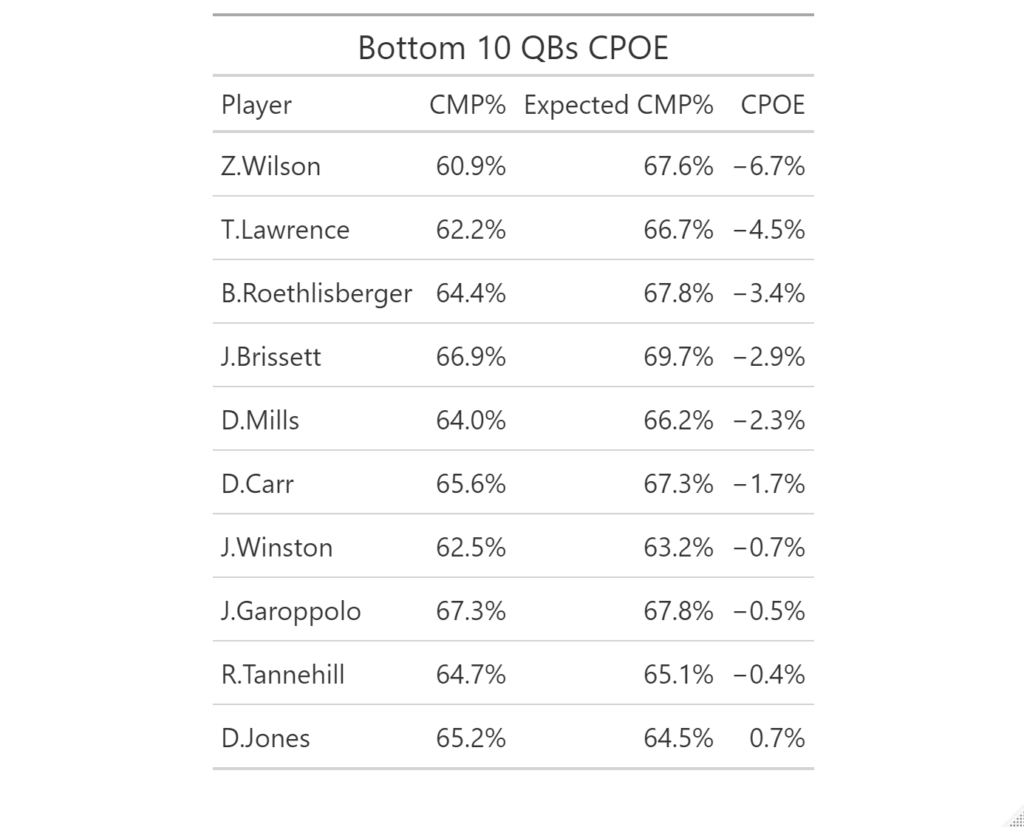
CPOE Leaders:
Joey DiCresce contributed to this story