Analysis
9/14/23
4 min read
Advanced Stats Tell Different Story on Patrick Mahomes' Week 1 Performance

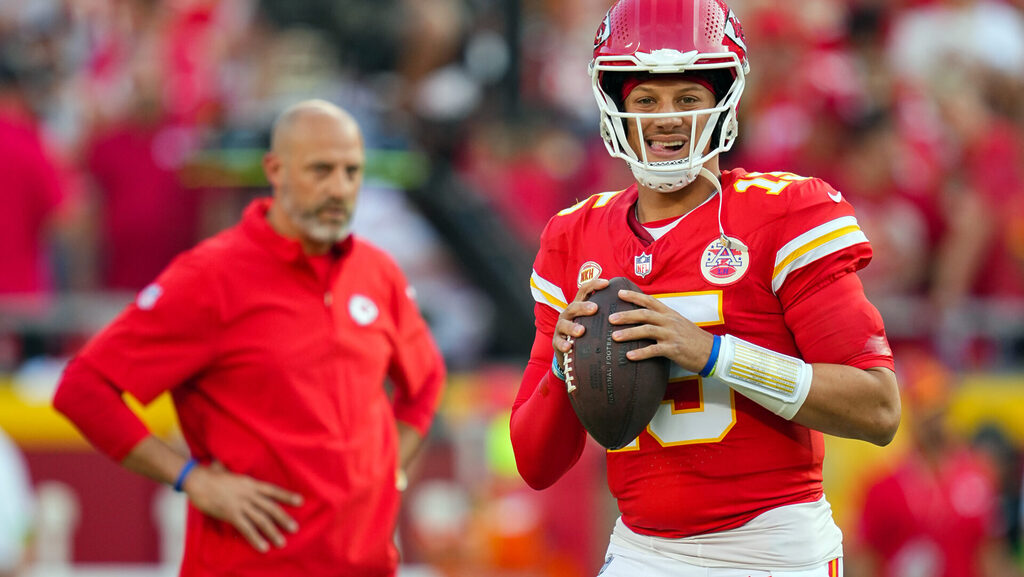
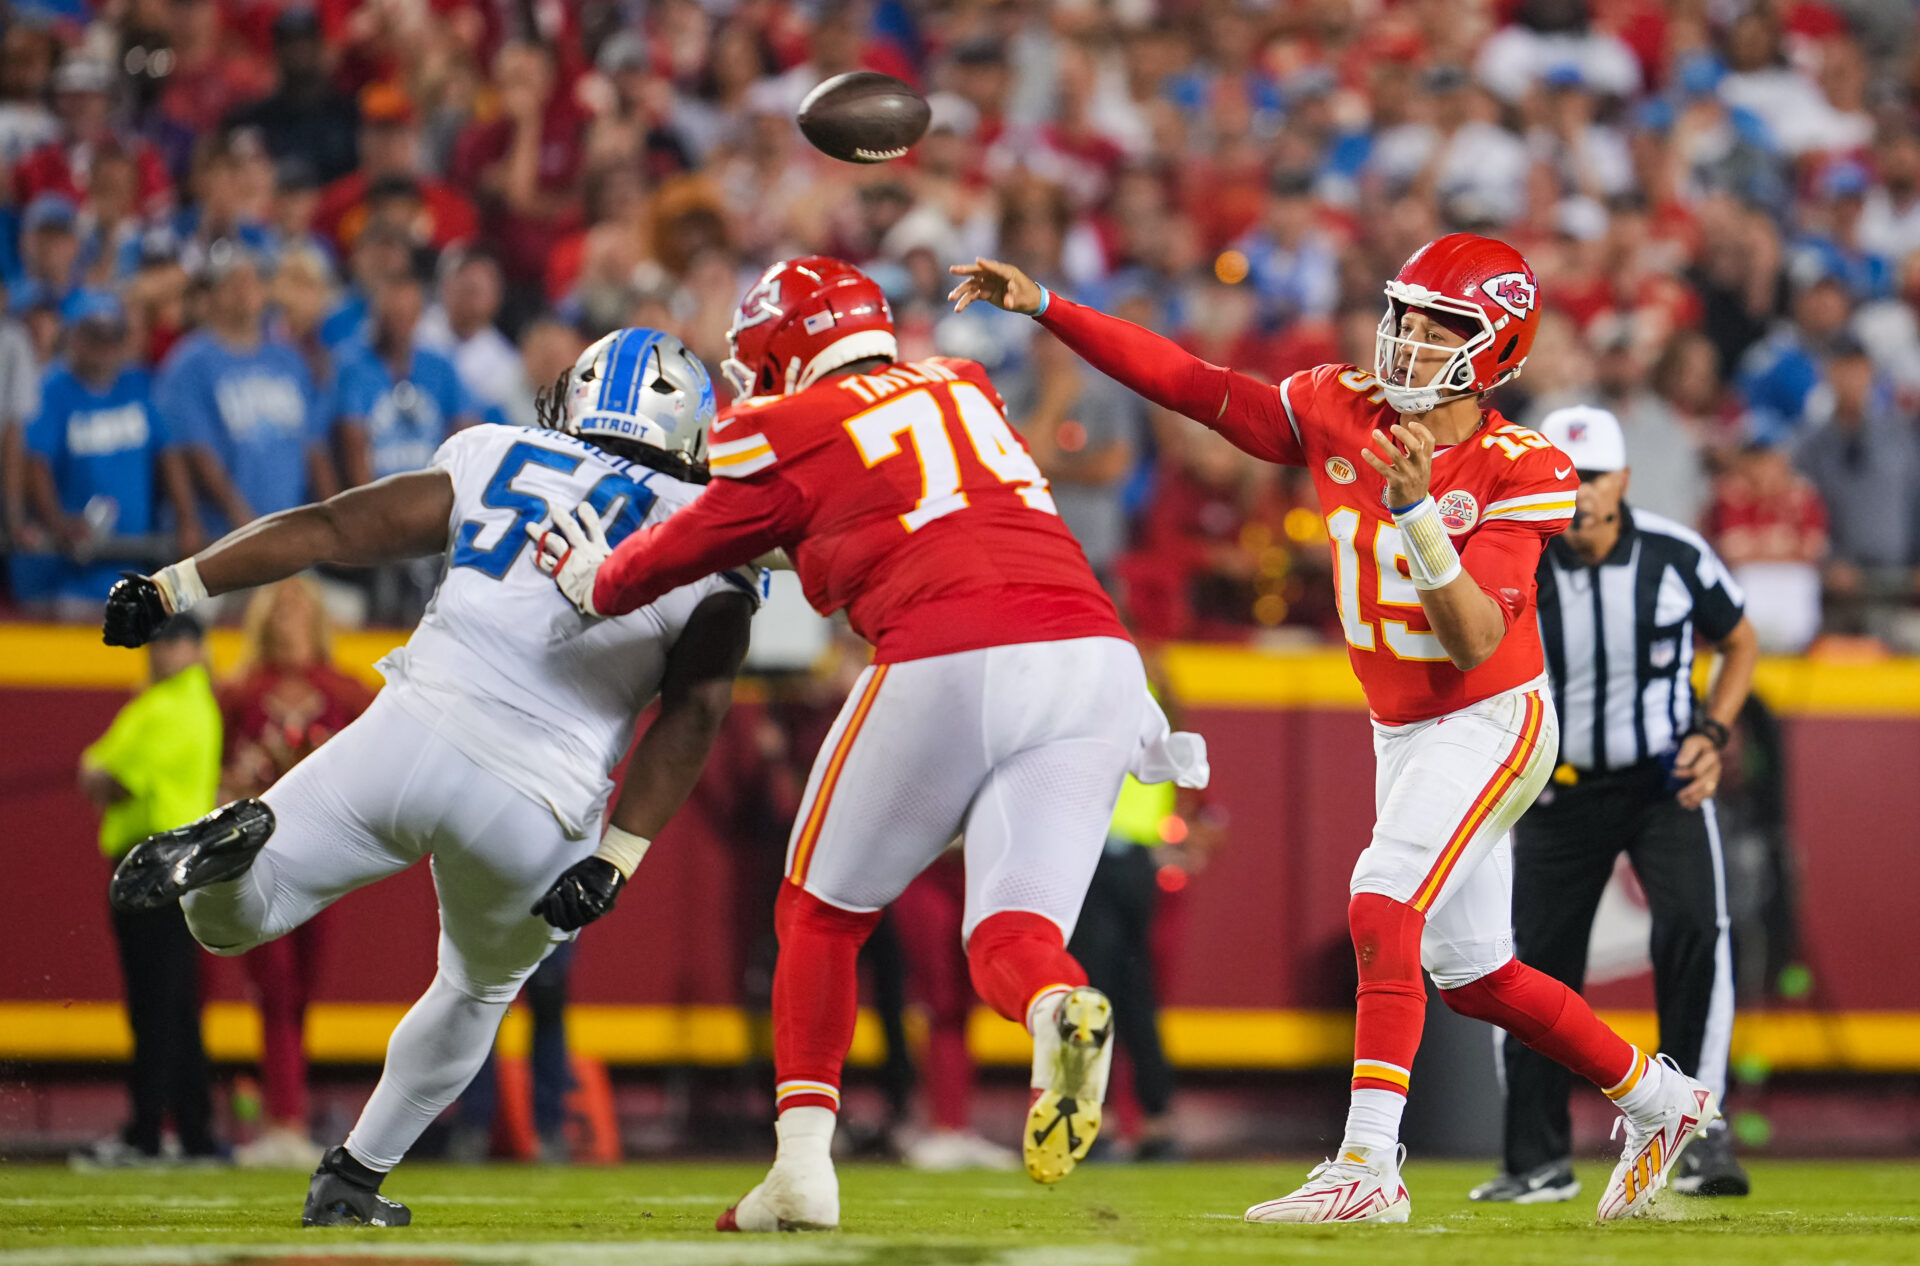
Patrick Mahomes had a rough day at the office on the opening Thursday of the season.
He posted a Passer Rating of 77.5, which is one of the 10 worst marks of his career (minimum 20 attempts).
From an Expected Points Added (EPA) perspective, his pass plays were worth -5 points, which again was one of the 10 worst marks of his career.
By each of those stats, the worst game of his career came in Super Bowl LV against the Tampa Bay Buccaneers, when Mahomes was under siege all night. That game had a similar DNA to this one in that most stats don’t accurately reflect Mahomes’ performance in the context of his teammates' actions.
When we take stock of a player’s performance — whether for awards voting or just understanding how valuable he is — it’s helpful to know how many grains of salt we need. And advanced charting data helps us get to those kinds of answers.
Adjusting Stats for Context
Take the Passer Rating first. We can improve upon that archaic metric (case in point, Desmond Ridder’s 111.8 from Week 1) by removing intentional throwaways and treating dropped passes as though they were completed. Sports Info Solutions calls this Independent Quarterback Rating (IQR).
Mahomes’ IQR in Week 1 wasn’t actually that much better: 80.6. It shows that his performance was better than typical stats show, but he was still on target an uncharacteristically low 65 percent of the time.
We really see the impact of the drops within the context of EPA. Those five dropped passes accounted for -9.7 EPA, which drove Mahomes’ total EPA into the negatives. That’s because two drops came on third down and another almost 20 yards downfield. These significant losses of opportunity hit hard from a team perspective — but they shouldn’t reflect poorly on Mahomes’ ledger.
If we wanted, we could treat those drops as complete passes, which would flip that considerable negative number to a positive number. It wouldn’t be as simple as +9.7 points instead of -9.7, but even eliminating that loss makes the statistical record of Mahomes’ game much different. Getting rid of that big -10 would turn a “yikes” game into a “solid if unspectacular” one.

Integrating Charting Data with Total Points
This is where SIS’s Total Points system flourishes. Not only does it consider these kinds of contextual factors when evaluating each play, but it does so for every player, all on the same scale.
On those dropped passes, we treat it like a completion for everyone but the receiver. That means the quarterback isn’t punished, nor is the defensive back credited any more than he should be.
Total Points measures Mahomes as worth four points more than average on those five drops. In comparison, the receivers were eight points below average — essentially bearing the complete burden of the value of the lost opportunity.
The Kansas City Chiefs also had some issues along the offensive line, surrendering 11 blown blocks in the passing game — a mark they’ve only exceeded 10 times in the Mahomes era. Typically, a play with a blown block is worth about half a point less in terms of EPA than a clean play. We use that estimate to penalize the line about five and a half points on these particularly troublesome snaps and give Mahomes a boost for performing in adverse conditions.
In sum, Mahomes ends up at 11 Passing Total Points for the game, which is a better-than-average performance (for a mortal). Most stats won’t make the necessary accommodations to reflect that.
And for those curious about the other side of the coin, Kadarius Toney’s one-yard, two-drop showing was worth -5 points, among the worst receiver outings Total Points has seen since its first season in 2016.
This story was authored by Alex Vigderman.


