Analysis
12/16/22
4 min read
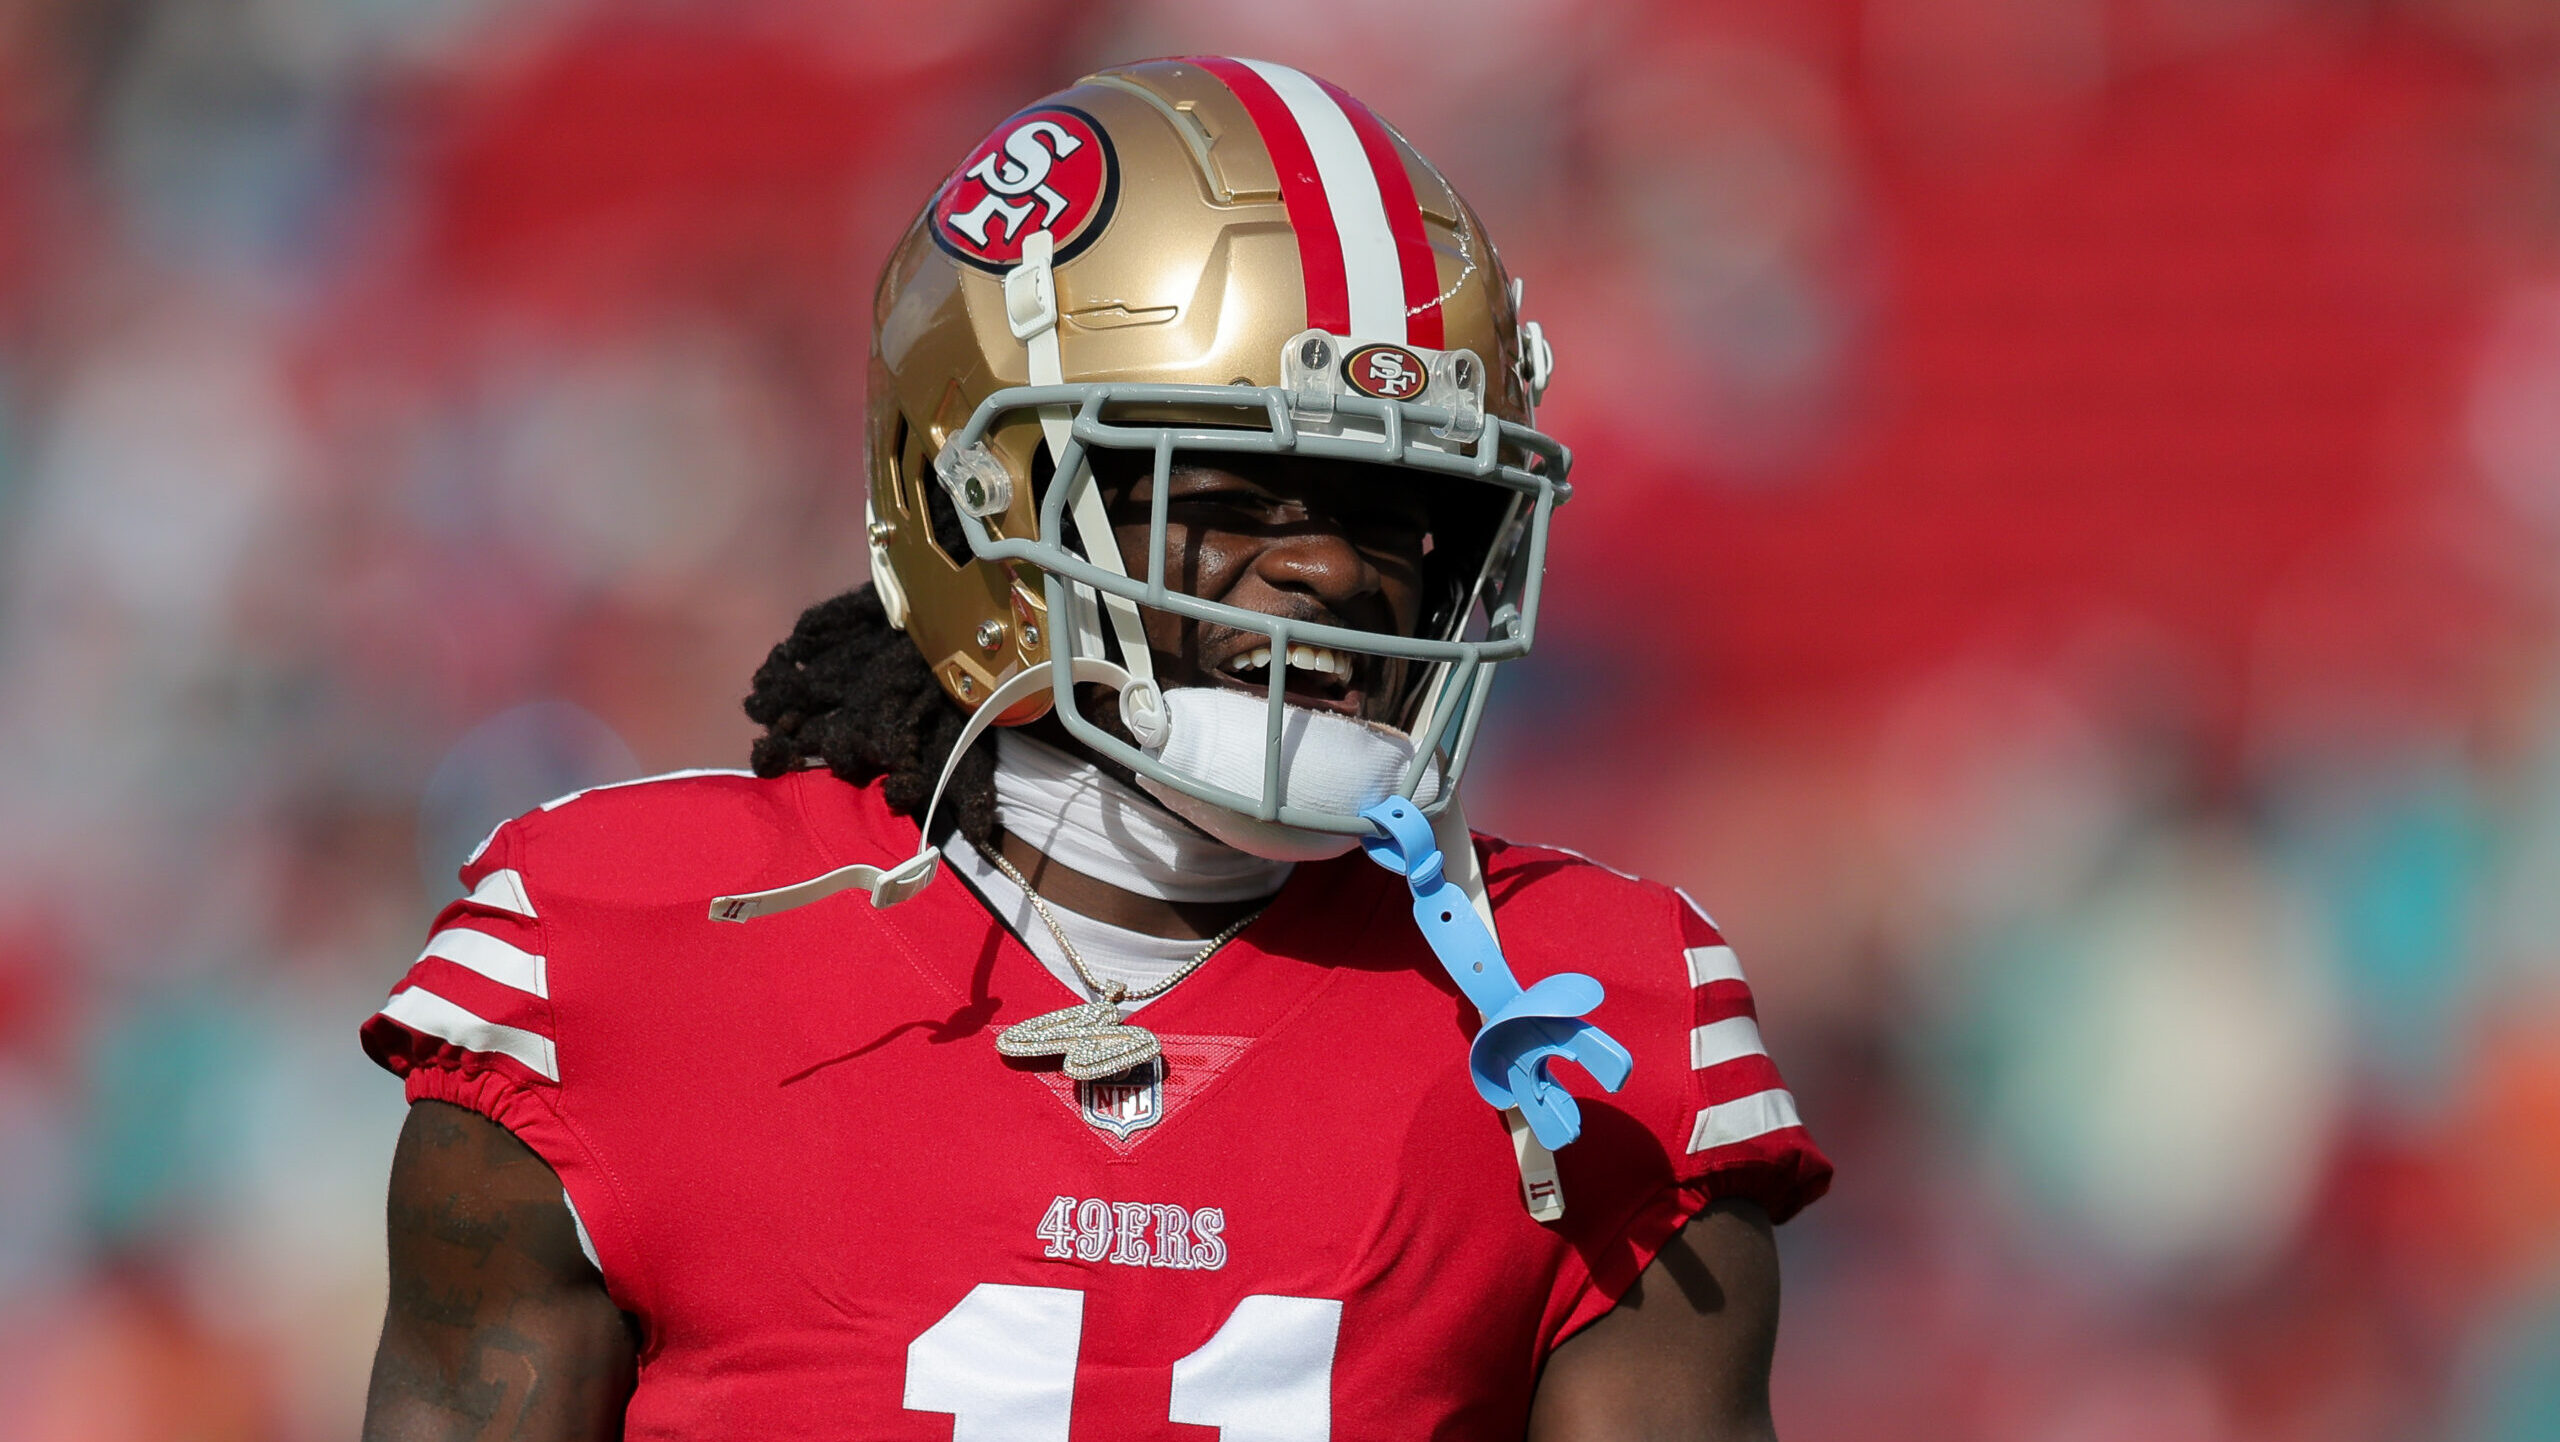
Can Deebo Samuel Withstand His Utilization?
It was back in April of this past year when Deebo Samuel requested a trade from the 49ers. It was a shocking development, especially as Samuel had experienced great success with the 49ers since they drafted him in the second round of 2019. In addition to team accomplishments of a Super Bowl appearance his rookie year, he was named a First Team All-Pro after ranking fifth in receiving yards and third in all-purpose yards last season, which concluded an NFC Championship Game loss.
Reports speculated that Samuel’s desire to be traded stemmed from his increased utilization as a running back. Although the speculation was never outright confirmed, the thought process behind it was that he wanted to preserve the longevity of his career. Running backs have demonstrated the highest injury risk amongst positions and thus are notorious for having a shorter shelf life than wide receivers.
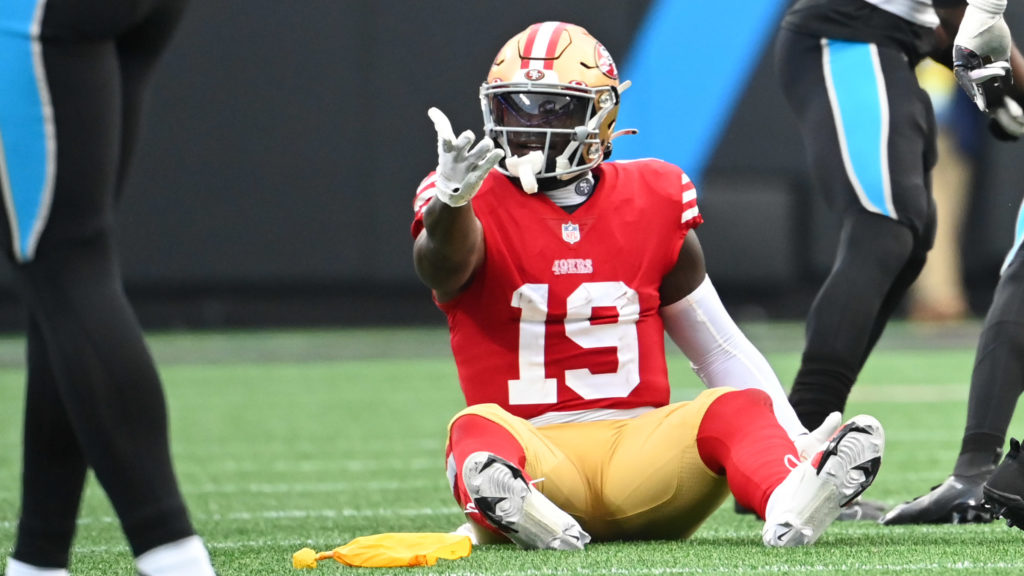
Samuel and the 49ers eventually reached an agreement in July for a three-year, $71.55 million extension. All systems forward until this past weekend where Samuel suffered a left sprained MCL and sprained ankle while being tackled on a rushing attempt. Head coach Kyle Shanahan suggested that Samuel may return to the field in Weeks 17 or 18, but the multi-million-dollar question looms: Can Samuel withstand his utilization?
Samuel was not regularly used as a rusher his first two seasons, averaging 1.0 and 1.1 attempts per game respectively, but that all changed as he averaged 4.5 attempts last season. Most of his work came after Week 8, where he rushed the ball at least five times each game, topping out at eight carries three times. His rushing workload has decreased this season, averaging 3.1 attempts per game, and only reaching eight carries once during his 12 outings.
The rushing workload may not appear significant, but things get interesting when you compare Samuel’s rushing distribution to the league’s trend. We evaluated runs by their intended designs and grouped them as middle (A gaps), inside (B and C gaps), and outside (D gaps).
A comparison since Samuel entered the league in 2019 can be seen below:
League-Wide Rushing Distribution
- Middle = 36.8%
- Inside = 41.8%
- Outside = 21.4%
Samuel’s Rushing Distribution
- Middle = 8.5%
- Inside = 28.8.%
- Outside = 62.74%
Obviously, Samuel’s designed runs are drawn up to get to the edge at a higher frequency than league average. What if I told you that the rate of injury increases as you go from middle runs to outside runs? That is exactly what Sports Info Solutions has observed since Samuel entered the league.
The rate of injury for ball carriers per 1,000 attempts is the following:
Injuries Per 1,000 Attempts
- Middle = 5.9
- Inside = 7.5
- Outside = 11.5
Keep in mind that the number of injuries per 1,000 attempts is of all rushing attempts and a subsequent injury occurring. It is not an evaluation of individual rushers per 1,000 attempts.
Not only is Samuel being asked to run the ball, which inherently carries an increased risk of injury, but most of his runs correspond to the highest rate of injury. If you were to give a player Samuel’s carry distribution and compare it to a typical rusher’s distribution, that player would have a 27% higher risk of sustaining an injury.
Does this mean that Samuel will suffer another injury while running the ball? No, but the probability of an injury occurring is higher for him given his current usage. Considering that $58.1 million of his three-year extension is guaranteed, it would be just for the 49ers to evaluate how he will be used once he returns.
James Rodriguez PT, DPT contributed to this report.