Analysis
1/12/23
5 min read
NFL Playoffs: Fourth-Down Efficiency Rankings
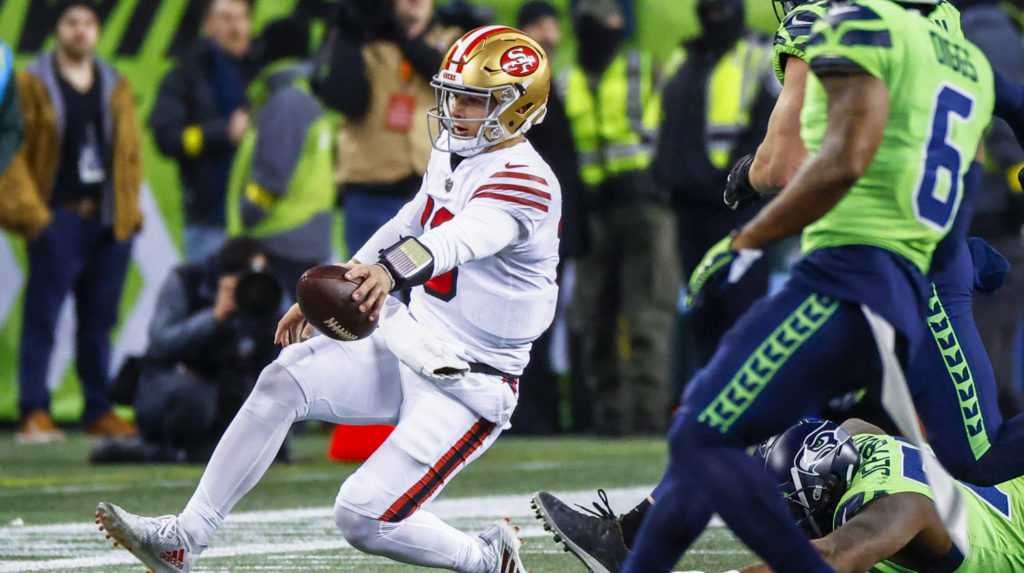
Not every fourth-down decision is difficult to make, but all of them are critical. That will especially be true in a playoff setting, when the best of the best are playing each other in a win-or-go-home situation. This is true even in the initial rounds – where the higher seeds play the lower seeds and, therefore, might be expected to have a matchup advantage – because even seemingly slight edges can make a difference.
With that in mind, we can take a look at how the playoff teams fared in their fourth-down decision-making during the regular season.
SIS tabulates every fourth-down decision and determines the optimal one based on the expected win probability of each choice. The underlying model is somewhat complicated, but comparing the differences in expected win probability isn’t.
For example, when weighing going for it versus kicking a field goal, you simply multiply the expected win probability (xWP) if you convert by the likelihood you will convert and then multiply the xWP if you don’t convert by the likelihood you fail. Add those together, and you get your result.
You then do the same for making the field goal, and then compare the two numbers to determine which is better.
This difference is referred to as expected win probability added plus or minus (xWPA +/-). The easy way to interpret this is that 100 points of xWPA are worth a win based on decisions alone. If you want to learn about the nitty-gritty of how this is calculated, you can do so here.
| Team | xWPA +/- | Rank |
| Eagles | 164.4 | 1 |
| Vikings | 136.8 | 3 |
| Bills | 134.3 | 4 |
| Seahawks | 84 | 12 |
| Cowboys | 77.6 | 15 |
| Dolphins | 63.2 | 17 |
| Ravens | 55.7 | 18 |
| Chargers | 35.9 | 20 |
| Bengals | 10.9 | 22 |
| Jaguars | 10.7 | 23 |
| Chiefs | -13.5 | 25 |
| 49ers | -15.2 | 26 |
| Buccaneers | -16.6 | 27 |
| Giants | -38.5 | 29 |
Unsurprisingly, Philadelphia tops the list here. The Eagles have long been one of the most analytically-inclined teams – relatively speaking – and that has shown itself both in the front office and in their fourth-down decision-making. They went for it 25 times this year, which has contributed to their big lead in xWPA +/-.
Considering that the Eagles have been fourth-down aggressors since before Nick Sirianni’s tenure, it is interesting that the worst individual fourth-down decision (among the playoff teams) was made by their former head coach Doug Pederson. The Jaguars hemorrhaged 22.7 points in xWPA when they punted on fourth-and-3 from their own 32-yard line with 8:56 to go in overtime against Dallas. Win probability does get a little funky in overtime because of the possibility of a tie, but they, of course, won that game on a walk-off pick-six by safety Rayshawn Jenkins.
[bc_video video_id="6318528925112" account_id="6312875271001" player_id="default" embed="in-page" padding_top="56%" autoplay="" min_width="0px" playsinline="playsinline" picture_in_picture="" language_detection="" max_width="640px" mute="" width="100%" height="100%" aspect_ratio="16:9" sizing="responsive" ]
On the flip side of that, the Vikings made the biggest decision in terms of xWPA, although they didn’t have much of a choice when they did so. They went for it on fourth-and-goal from Buffalo’s 1-yard line, down 4 with one timeout left and 50 seconds to go in the fourth quarter. They gained 47.7 xWPA by doing so, but the call to go for it was a no-brainer. The second-best decision was when the Chargers went for it on fourth-and-1 from their own 46-yard line, up 2 points with 1:14 left to go against the Browns. That was a much more bold call, but it was 27.2 points of xWPA better than punting.
The Chargers' decision was especially interesting because it was out of character for them; they went for it just 27 percent of the time when it was the optimal choice. By comparison, the Eagles went for it 46 percent of the time when it was most optimal. Even the most aggressive team failed to get it right half the time, which goes to show that even the most analytically inclined teams leave some meat on the bone.
Perhaps the most unsettling placement on the above list is the Chiefs, who have a world-beater at quarterback. You think they’d be more inclined to place trust in Patrick Mahomes than their defense, but they lost 13.5 xWPA on fourth downs altogether and 91.5 xWPA in go-for-it situations. The model for this exercise is team-agnostic, so this is even worse considering how much likelier you are to convert when Mahomes is your quarterback.
[bc_video video_id="6318476919112" account_id="6312875271001" player_id="default" embed="in-page" padding_top="56%" autoplay="" min_width="0px" playsinline="playsinline" picture_in_picture="" language_detection="" max_width="640px" mute="" width="100%" height="100%" aspect_ratio="16:9" sizing="responsive" ]
No team has been worse in this regard than the Giants, though. They’ve ceded a total of 38.5 xWPA this year, and their unwillingness to capture edges on fourth down might be a problem considering they’re one of the weaker teams in this year’s playoff field.
A lot goes into fourth-down decisions, and while it’s easy to jeer the man in the arena, it’s not always black and white. While some of the bigger swings here have been highlighted in xWPA, a lot of these decisions are small differences, and a coach could override the chart for better or for worse.
There were 119 instances this season where a team should have punted or kicked a field goal and instead went for it, although that number pales in comparison to the inverse, which occurred 1,518 times (roughly a couple of times a game for each team). There will be lots of opportunities to scrutinize these coaches starting this weekend, so let this be your guide.
For better or for worse.
Bryce Rossler contributed to this report.
WATCH: Giants vs. Vikings Betting Preview
[bc_video video_id="6318527238112" account_id="6312875271001" player_id="default" embed="in-page" padding_top="56%" autoplay="" min_width="0px" playsinline="playsinline" picture_in_picture="" language_detection="" max_width="640px" mute="" width="100%" height="100%" aspect_ratio="16:9" sizing="responsive" ]


