Betting
8/16/22
4 min read
Are Vegas Totals Trustworthy?

To better understand how accurate Vegas’ win total lines were, we collected pre-season lines dating back to 2002 and compared that to how many wins each team actually had. In the below chart, the size of the bubble represents how many teams finished with that total, and the dotted line represents the line of best fit.
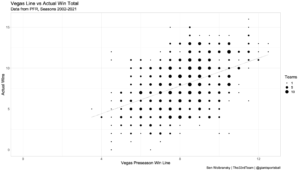
Vegas’ Mean Average Error (or MAE) was 2.2 wins. Essentially, this means that, on average, Vegas is within 2.2 wins in either direction of their projected win line total. This is accurate in the sense that it’s close, but it’s not accurate in the traditional sense. After all, Vegas has been off as much as 8.5 wins for a single win total line.
We must remind ourselves that Vegas isn't in the business of making precise lines; they're in the business of making money. Sportsbooks don’t make money by making good projections; sportsbooks make money by setting profitable lines.
In theory, this means that win total lines should go over 50% and under 50% of the time. Chosen at complete random, we’d expect an average of 16 overs and 16 under per season.
Vegas Totals: Theory vs. Reality
But in reality, we know that bettors prefer to take the over instead of the under. For example, if you take the Jets to win more than five games, this bet could hit in Week 6. When you bet the under, you must wait until at least week 14 for this bet to hit. Psychologically, this is less agonizing, and it’s why overs are more popular.
Bettors more frequently betting over on win totals are why we see unders hit more frequently. Betting the under on a pre-season total is 311-295.
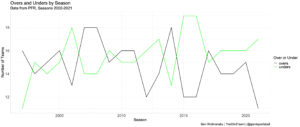
We see an average of 15.5 unders per season vs. 14.75 overs per season (pushes exist too, on average 1.89 per season). Given that under are more likely to hit, should we blindly take unders and expect a profit?
Let’s take a look at each win line and how many teams finished over or under that total.
Vegas Totals by Number and Under Win Percentage
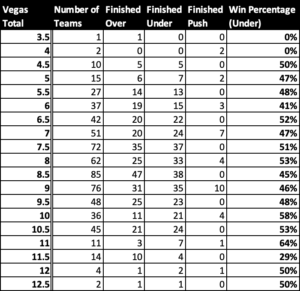
It seems like the answer is yes, taking unders is profitable since they occur most frequently. Unfortunately, we need to consider the average odds on preseason win totals are just about -110. Therefore, if you bet $100 and win, you get ~$191 back for a ~$91 profit. You didn’t double your money and receive $100 in profit because the remaining $9 is the sportsbook’s commission, aka the “vig” or “juice.”
If we assume a bettor bet $100 on every under dating back to 2002 at -110 odds, they would have lost $1,230.10 in 20 seasons. This bettor becomes profitable when the average odds are -105 or higher, which is not common to find on futures.
So is there a number where taking the under becomes profitable? Basically, let's not just take every under – let's take unders where optimal.
Which Unders To Take
Remember earlier when we said that, on average, Vegas win totals were off by 2.2 wins? Let’s use that number to create buckets of teams. When a team is listed at 4.5 win totals, we’ll look at how all teams with a win total of 2.5 to 6.5 finished (These numbers are 4.5 +- the MAE of 2.2). When interpreting the table below, there were 55 team win totals within 2.2 wins of 4.5; 26 of those went over, 25 went under and 4 were a push.
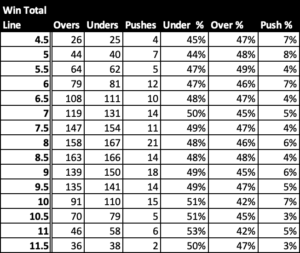
Since 2002, betting unders on teams with a line between 9 & 13 wins has been the most profitable strategy (52.7%). Our same bettor from earlier would have risked $11,000 to profit $923.81 dating back to 2002. This is an 8.4% rate of return.
How much edge is there? Is there an edge?
Using a Monte Carlo simulation for this upcoming season using the probabilities from the above table and the following odds:
| Probabilities | |
|---|---|
| Over | 41.82% |
| Under | 52.73% |
| Push | 5.45% |
Best Vegas Total Odds
| Team/Pick | Current odds |
| GB u11 | -110 |
| IND u10 | -115 |
| LAR u10.5 | -115 |
| DAL u10 | -110 |
| DEN u10 | -105 |
| 49 u10 | -120 |
| CIN u10 | -125 |
| KC u10.5 | -105 |
| LAC u10 | +115 |
Simulated 1000 times, we were profitable in 586 simulations. We saw an average return of $40 after investing $900. That is a 4.4% rate of return. The average rate of return for the S&P 500 is 10.5% over 365 days. We see a 4.4% return over 128 days (18 weeks of NFL season). Over the same period of 18 weeks of the NFL season, you’d see, on average, a 3.73% rate of return from the S&P 500. If historical trends are any indicator, you can beat the S&P 500 this year by betting the under on teams with 9-13 wins.