Breakdowns
3/21/22
10 min read
The More You Can Do: Part 3
Charles Brensinger worked in the NFL in various Personnel Department roles for nearly a decade. Most recently, he served as a Pro Scout for the Detroit Lions from 2016-2020.

In this third and final installment of "The More You Can Do," I'll examine, at a team level, what offenses across the league force the highest percentage of non-traditional defensive personnel to be deployed in matching their offensive personnel.
Typically defenses will match offensive personnel, i.e. if the offense deploys 11 personnel (1 RB/1TE/3WR), the defense will counter with Nickel (5 DBs). If the offense comes out in a larger personnel group, say 21 personnel or 12 personnel, traditionally the defense will counter with their base package (4 DBs). There are certain down/distance situations that may alter this, but this is traditionally the standard operating procedure for NFL defenses.
The thought process here being — identifying offenses that see non-traditional defensive packages to match their on-field personnel at a higher percentage than is typical of the average NFL offense could be an indicator that the offense may employ players that present matchup difficulties for a defense, or that the offense employs their personnel in a non-traditional manner. Another possibility is the offense functions abnormally in said personnel groupings, such as if an offense has an extremely abnormal run/pass ratio in a certain personnel grouping.
Once said teams are identified, I'll tie it back into the previous two articles by examining who the versatile players on their roster are, what position they play, and if there are any commonalities in personnel among the identified teams that could account for why defenses choose to counter their offensive personnel with non-traditional defensive packages.
As in the previous two articles, garbage time was removed from the sample to account for extreme in-game situations, which require a defense to defend the situation as opposed to the personnel. All variations of offensive personnel groupings containing an extra offensive linemen were also removed in order to account for the possibility of the defense adjusting to match a heavy personnel group.
Personnel Key:
Offense - Offensive personnel is identified first by the number of RBs on the field (first digit) followed by the number of TEs on the field (2nd digit).
|
Personnel |
RB (HB & FB) | TE | WR |
|
21 |
2 | 1 | 2 |
| 12 | 1 | 2 |
1 |
| 11 | 1 | 1 |
3 |
Defense - Defensive packages are identified solely by the number of defensive backs that are on the field, regardless of whether a team operates from a 4-3 or 3-4 base defense.
|
Package |
DB |
| Base |
4 |
| Nickel |
5 |
| Dime |
6 |
21 PERSONNEL (1 HB/1 FB/1 TE)
|
TEAM |
vs BASE | 21P RUN % (vs all Def packages) | 21P PASS % (vs all Def packages) | TEAM | vs NICKEL | 21P RUN % (vs all Def packages) | 21P PASS % (vs all Def packages) | TEAM | vs DIME | 21P RUN % (vs all Def packages) | 21P PASS % (vs all Def packages) |
| Jaguars (1 PLAY ) | 100% | 100% | 0% | Dolphins (8 PLAYS) | 88.90% | 11.10% | 88.90% | Chargers | 16.60% | 25.80% | 74.20% |
| Browns | 88.60% | 47.70% | 52.30% | Cowboys | 88.90% | 37.00% | 63.00% | Seahawks | 8.30% | 50.00% | 50.00% |
| Vikings | 87.90% | 51.70% | 48.30% | Packers | 87.50% | 37.50% | 62.50% | Eagles | 6.30% | 25.00% | 75.00% |
| Steelers | 86.70% | 90.00% | 10.00% | Colts | 82.90% | 43.40% | 56.60% | Raiders | 6.20% | 46.40% | 53.60% |
| Patriots | 85.70% | 60.20% | 39.80% | Broncos | 80.80% | 46.20% | 53.80% | Texans | 6.10% | 54.50% | 45.50% |
| 49ers | 84.10% | 54.20% | 45.80% | Cardinals | 78.30% | 73.90% | 26.10% | Ravens | 5.50% | 44.50% | 55.50% |
| Titans | 78.40% | 63.70% | 36.30% | Texans | 75.80% | 54.50% | 45.50% | Falcons | 5.00% | 47.50% | 52.50% |
| Bills | 76.60% | 49.40% | 50.60% | Eagles | 75.90% | 25.00% | 75.00% | Cowboys | 3.70% | 37.00% | 63.00% |
| Chiefs | 75.00% | 66.70% | 33.30% | Commanders | 74.40% | 53.80% | 46.20% | Saints | 2.90% | 47.80% | 52.20% |
| Panthers | 74.00% | 60.40% | 39.60% | Bears | 57.10% | 64.30% | 35.70% | Commanders | 2.60% | 53.80% |
46.20% |
|
NFL AVG (15 teams above average) |
53.36% (51.83 instances) | 52.00% | 48.00% | NFL AVG (13 teams above average) | 43.36% (22.5 instances) | 52.00% | 48.00% | NFL AVG (10 teams above average) | 2.38% (1.7 instances) | 52.00% |
48.00% |
Teams that see the most base defense (4 DBs) vs 21 personnel are listed to establish a baseline, as this is the defensive package one would traditionally expect a defense to counter 21 personnel with. This will be done for all offensive personnel groups examined in this article, i.e. Base vs 12 personnel, Nickel vs 11 personnel.
What I'm interested in regarding the chart listed above is the teams that see Nickel and Dime defenses most often vs this personnel grouping. I found it interesting that DAL, HOU, PHI, and WAS (highlight in bold) were present on both lists (Nickel and Dime). While some teams came pretty close to even in their run/pass splits, many of the teams listed had a tendency to pass more than run in these situations, even when the lighter defensive personnel established an advantage for the offense to run the ball.
This run/pass tendency could be a possible explanation as to why those particular teams see a lighter defensive package against their heavier 21 personnel grouping. Only 4 teams (underlined) tended to run the ball more often than pass the ball in these situations, with ARZ (73.90%) and CHI (64.30%) being the most run-heavy. Could the teams that still choose to pass, even when there is a clear personnel advantage to run the ball, have players such as TEs, RBs, and FBs with the versatility to allow them to function in this manner? Or could other factors, such as down and distance, account for this tendency?
None of the four teams highlighted above featured a FB in 21 personnel, with the majority of the teams not even rostering a true FB during the 2021 regular season. When a blocking FB was necessary in short yardage and goal line situations, many of these teams simply deployed an extra OL or TE.
Each of the highlighted teams in this case featured 2 RBs in their 21 personnel grouping, which is typically identified as 21 Pony or 21 Out, indicating the usage of 2 RBs as opposed to the traditional deployment of a FB. Defenses will counter this grouping in a different manner than the traditional grouping as the skills sets of RBs and FBs tend to differ.
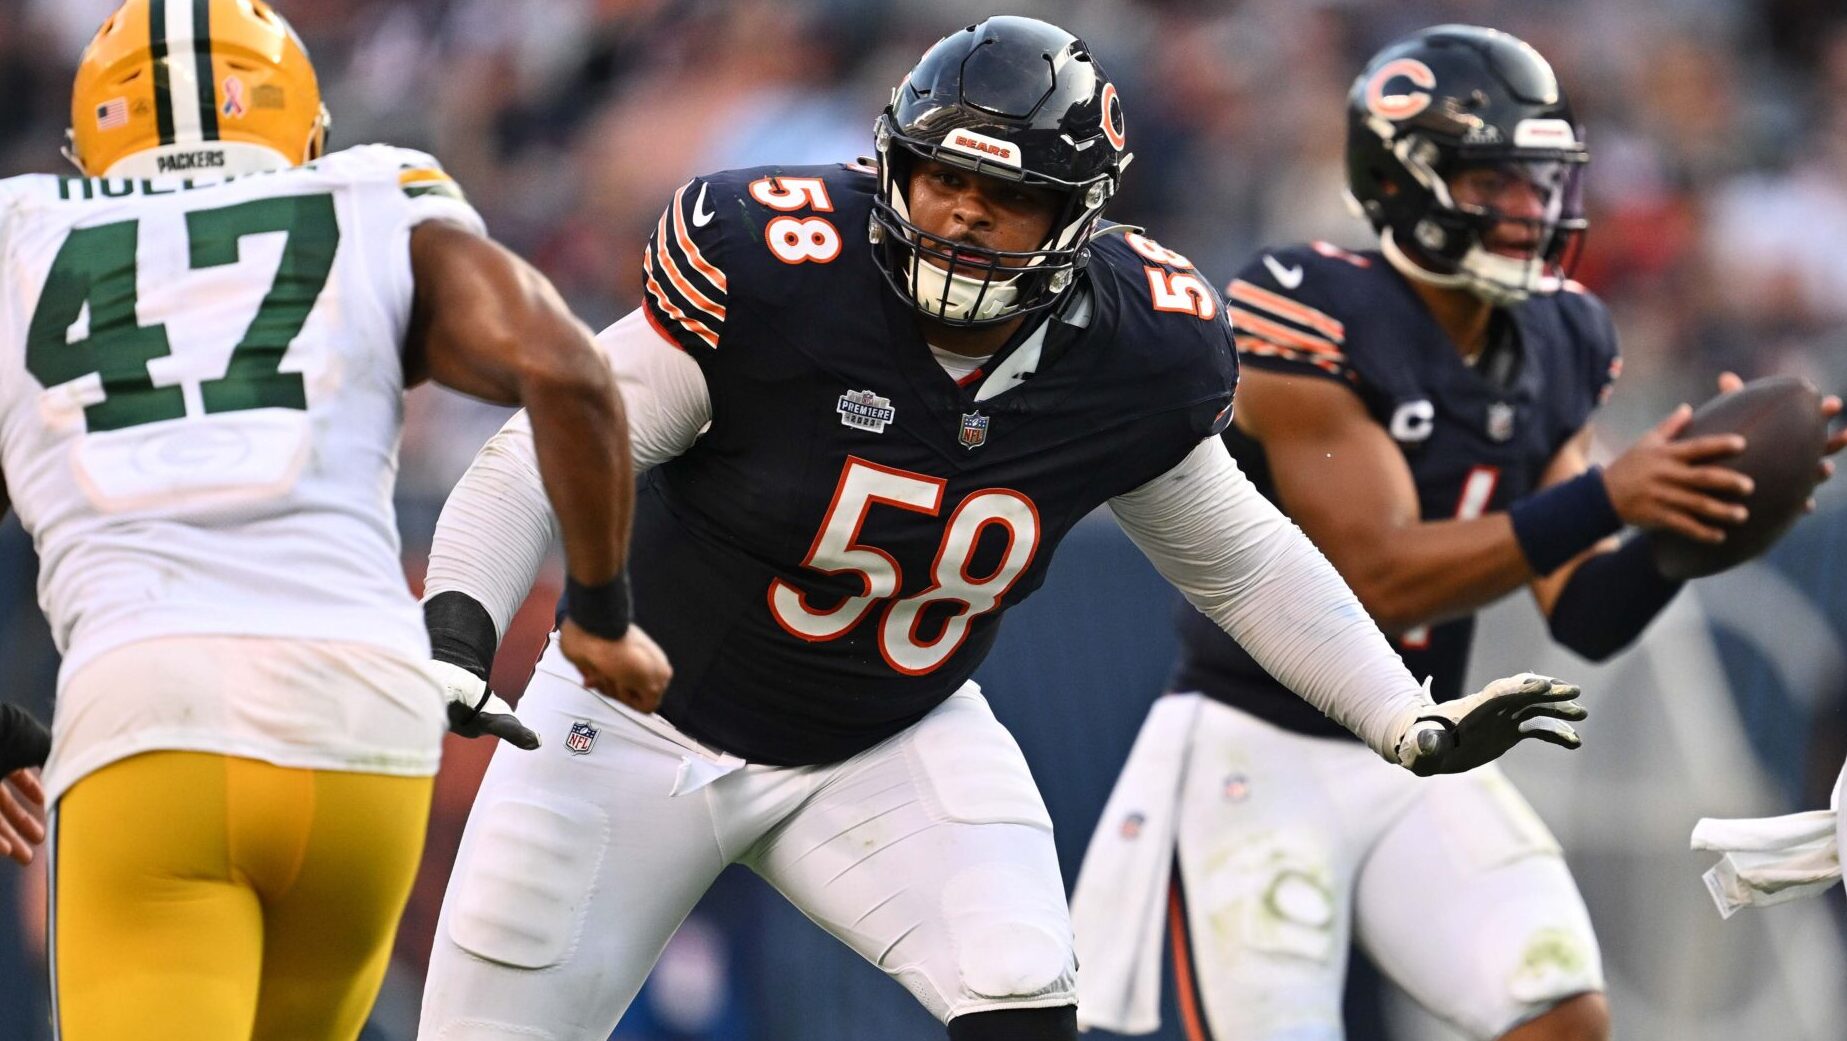
Nearly all of the highlighted teams had 1 or more RBs that appeared on at least one of the versatility charts in previous installments of this article, with the exception of Chicago. In many cases these RBs possess a skills set that allows them to essentially function as a 3rd WR, necessitating that the defense counter with 5 or 6 defensive backs (Nickel or Dime). For the teams that did not have a versatile RB, the tendency was for them to possess a versatile TE (CHI - Cole Kmet & DEN - Albert Okwuegbunam).
Cowboys: Tony Pollard (RB), Zeke Elliott (RB), Dalton Schultz (TE), CeeDee Lamb (WR)
Texans: Rex Burkhead (RB)
Eagles: Kenneth Gainwell (RB), Miles Sanders (RB), Dallas Goedert (TE)
Commanders: J.D. McKissic (RB)
Packers: Aaron Jones (RB)
Colts: Nyheim Hines (RB)
Broncos: Albert Okwuegbunam (TE)
Cardinals: James Conner (RB), Chase Edmonds (RB), Zach Ertz (TE)
Bears: Cole Kmet (TE), Jakeem Grant (WR), Darnell Mooney (WR)
12 PERSONNEL (1 RB/2 TEs)
| TEAM | vs BASE | 12P RUN % (vs all Def packages) | 12P PASS % (vs all Def packages) | TEAM | vs NICKEL | 12P RUN % (vs all Def packages) | 12P PASS % (vs all Def packages) | TEAM | vs DIME | 12P RUN % (vs all Def packages) |
12P PASS % (vs all Def packages) |
| 49ers | 82.60% | 63.00% | 37.00% | Dolphins | 80.30% | 40.10% | 59.90% | Raiders | 17.90% | 38.30% | 61.70% |
| Jaguards | 78.50% | 56.60% | 43.40% | Chiefs | 79.60% | 44.80% | 55.20% | Falcons | 13.40% | 30.60% | 69.40% |
| Titans | 78.00% | 54.20% | 45.80% | Buccaneers | 72.90% | 38.20% | 61.80% | Ravens | 11.80% | 28.40% | 71.60% |
| Colts | 73.50% | 58.80% | 41.20% | Falcons | 66.80% | 30.60% | 69.40% | Chiefs | 9.10% | 44.80% | 55.20% |
| Bengals | 73.40% | 56.50% | 43.50% | Eagles | 64.30% | 63.20% | 36.80% | Lions | 7.80% | 49.20% | 50.80% |
| Rams | 73.30% | 67.80% | 32.20% | Raiders | 60.20% | 38.30% | 61.70% | Giants | 6.30% | 37.10% | 62.90% |
| Jets | 72.20% | 56.60% | 43.40% | Saints | 60.00% | 50.80% | 49.20% | Dolphins | 6.20% | 40.10% | 59.90% |
| Packers | 69.70% | 52.30% | 47.70% | Bills | 59.70% | 64.50% | 35.50% | Saints | 6.20% | 50.80% | 49.20% |
| Lions | 67.20% | 49.20% | 50.80% | Patriots | 53.40% | 48.60% | 51.40% | Browns | 5.50% | 43.40% | 56.60% |
| Panthers | 62.60% | 48.80% | 51.20% | Giants | 51.60% | 37.10% | 62.90% | Cardinals | 4.30% | 47.80% | 52.20% |
|
NFL AVG (19 teams above average) |
52.54% (108.38 instances) | 49.30% | 50.70% | NFL AVG (13 teams above average) | 43.1% (101.5 instances) | 49.30% | 50.70% | NFL AVG (11 teams above average) | 3.45% (7.72 instances) | 49.30% |
50.70% |
Again, while some teams came close to even in their run/pass splits, many of the teams listed had a tendency to pass more than run in these situations, despite the size advantage discussed above. There are six teams (highlight in bold) that rank in the top 10 in terms of frequency with which they face both Nickel and Dime vs 12 personnel. Of the 13 teams listed, only three of them ran the ball at a higher frequency than they passed the ball (PHI, NO, and BUF — who are underlined). DET appears to be a strange outlier as they are the only team that appears in the top 10 in terms of seeing both base and dime packages vs 12 personnel.
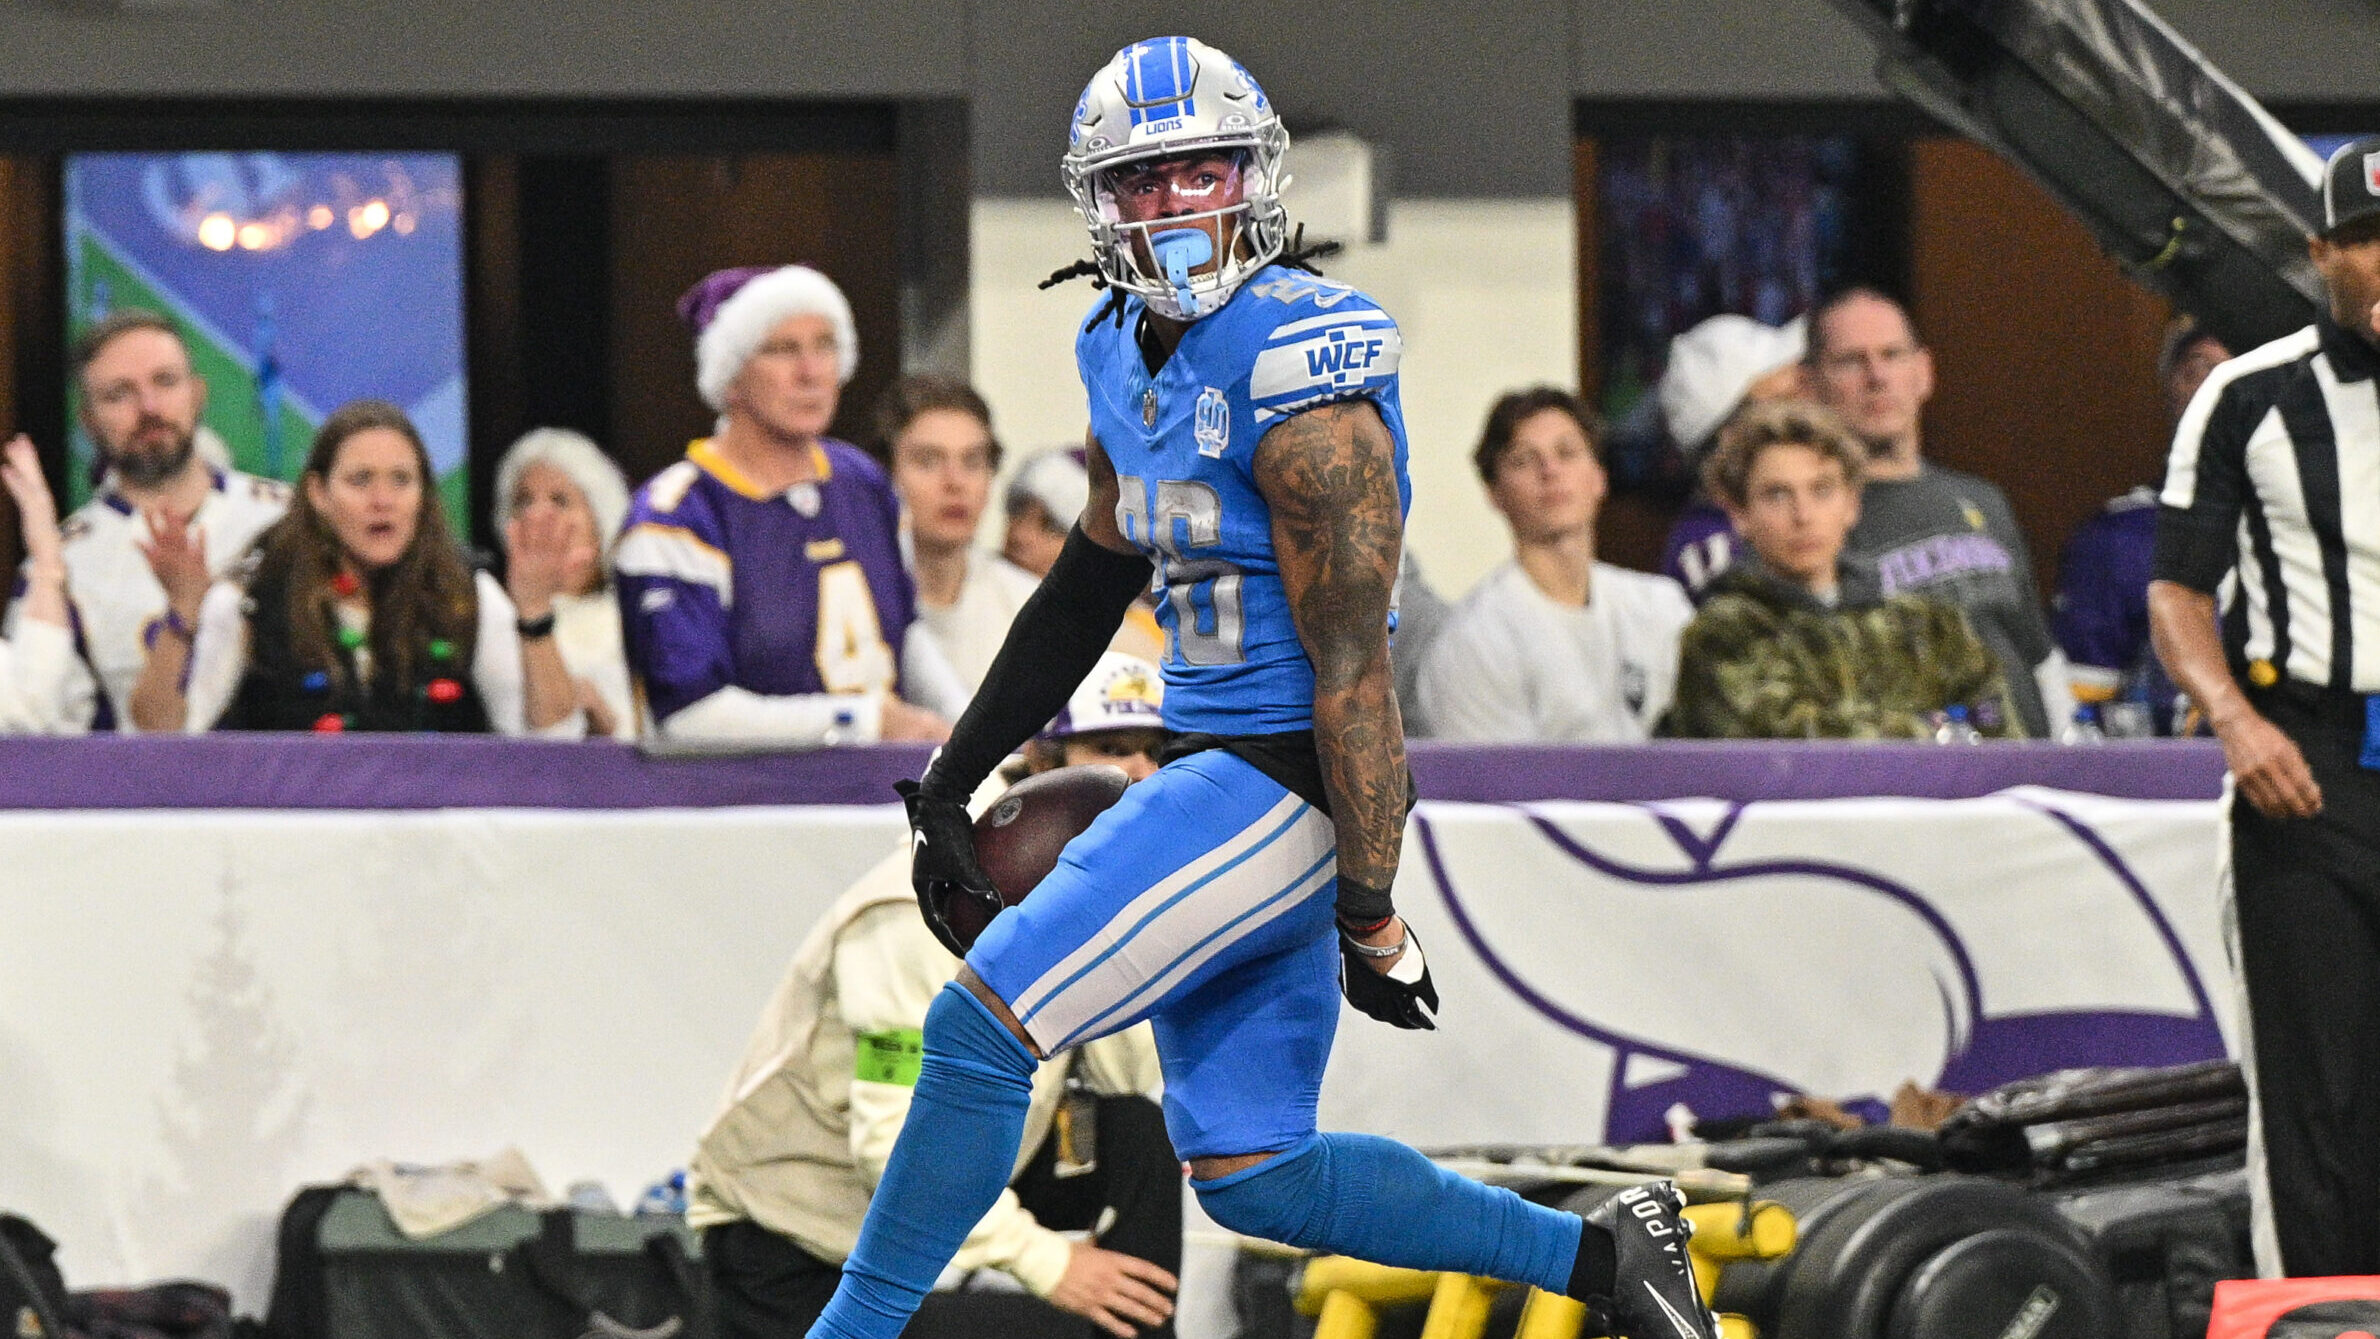
Every team aside from NO has a TE that appeared on the versatility charts in some capacity. Adam Trautman led the way for Saints' TEs with 151 versatile snaps (ranks 32nd in NFL) with Juwan Johnson (a converted WR) ranking 43rd with 129 versatile snaps. The Saints were the most balanced team on this list in terms of their run/pass split (50.80%/49.20%). Despite owning the 7th highest rushing grade out of 12 personnel, the Saints 366 rushing yards gained only ranked 23rd in the NFL, which could explain why defenses were content with playing Nickel vs the Saints 12 personnel grouping.
Dolphins: Mike Geiski (TE), Myles Gaskin (RB)
Chiefs: Travis Kelce (TE), Darrell Williams (RB)
Falcons: Kyle Pitts (TE), Cordarrelle Patterson (RB), Mike Davis (RB)
Raiders: Darren Waller (TE), Kenyan Drake (RB), Josh Jacobs (RB)
Saints: Alvin Kamara (RB), Ty Montgomery (WR)
Giants: Evan Engram (TE), Saquon Barkley (RB)
Buccaneers: Rob Gronkowski (TE), Leonard Fournette (RB)
Eagles: Dallas Goedert (TE), Kenneth Gainwell (RB), Miles Sanders (RB)
Bills: Dawson Knox (TE), Devin Singletary (RB)
Patriots: Hunter Henry (TE)
Lions: D'Andre Swift (RB)
11 PERSONNEL (1 RB/1 TE)
| TEAM | vs BASE | 11P RUN % (vs all Def packages) | 11P PASS % (vs all Def packages) | TEAM | vs NICKEL | 11P RUN % (vs all Def packages) | 11P PASS % (vs all Def packages) | TEAM | vs DIME | 11P RUN % (vs all Def packages) |
11P PASS % (vs all Def packages) |
| 49ers | 11.00% | 29.20% | 70.80% | Rams | 88.60% | 33.00% | 67.00% | Raiders | 30.90% | 27.10% | 72.90% |
| Saints | 11.00% | 32.70% | 67.30% | Jets | 85.90% | 24.70% | 75.30% | Ravens | 28.70% | 17.30% | 82.70% |
| Browns | 6.20% | 33.10% | 66.90% | Titans | 85.40% | 32.30% | 67.80% | Chiefs | 28.40% | 22.00% | 78.00% |
| Lions | 5.30% | 29.90% | 70.00% | Jaguars | 84.30% | 27.30% | 72.60% | Broncos | 27.30% | 30.80% | 69.20% |
| Titans | 4.50% | 32.20% | 67.80% | Patriots | 82.80% | 27.30% | 72.70% | Vikings | 26.70% | 22.50% | 77.50% |
| Colts | 4.00% | 31.80% | 68.20% | Dolphins | 81.60% | 18.40% | 81.60% | Seahawks | 25.10% | 30.40% | 69.60% |
| Cowboys | 3.70% | 23.80% | 76.20% | Buccaneers | 81.20% | 25.70% | 74.30% | 49ers | 25.10% | 29.20% | 70.80% |
| Packers | 3.60% | 31.10% | 68.90% | Steelers | 81.00% | 27.40% | 72.60% | Chargers | 23.60% | 19.60% | 80.40% |
| Bears | 3.40% | 31.20% | 68.80% | Panthers | 80.90% | 29.90% | 70.10% | Cowboys | 22.60% | 23.80% | 76.20% |
| Vikings | 3.40% | 22.50% | 77.50% | Bears | 80.30% | 31.20% | 68.80% | Browns | 22.50% | 33.10% | 66.90% |
|
NFL AVG (12 teams above average) |
2.89% (17.16 instances) | 28.20% | 71.80% | NFL AVG (20 teams above average) | 77.02% (490.81 instances) | 28.20% | 71.80% | NFL AVG (11 teams above average) | 19.37% (121.44 instances) | 28.20% |
71.80% |
It's interesting that the defenses matched up with these four teams highlighted above at both a top 10 percentage with a heavier package (Base) and lighter package (Dime) vs their 11 personnel grouping. This could indicate a personnel group versatile enough to present size/strength mismatches in addition to athletic/speed mismatches.
Nearly every team listed below has a RB who can function as a WR or a WR who can function in some capacity as a RB. In some of these cases, i.e. Demetric Felton (CLV) and Ty Montgomery (NO), the individual teams' defenses may vary in terms of how they identify these specific players. Some teams may consider them RBs, while others consider them WRs, regardless of what their listed as on the depth chart.
Minnesota and Tennessee are the two teams that seem to stray from this tendency. Both appear to see a lot of Base vs 11 personnel due to down/distance/situation as opposed to matchup problems caused by versatile offensive players. Both teams also share the commonality of having two top-notch WRs (Minnesota = Justin Jefferson & Adam Thielen; Tennessee = A.J. Brown & Julio Jones) in the sample year, but not much else in terms of skill players who would cause matchup problems vs Base personnel.
BASE + DIME
49ers: George Kittle (TE), Deebo Samuel (WR)
Browns: Demetric Felton (WR) -- College RB who fills a combo role and is also a returner.
Cowboys: Dalton Schultz (TE), Tony Pollard (RB), Zeke Elliott (RB), CeeDee Lamb (WR)
Vikings: Tyler Conkilin (TE)
BASE
Saints: Alvin Kamara (RB), Ty Montgomery (WR)
Lions: D'Andre Swift (RB), Amon-Ra St. Brown (WR)
Titans: No Players
Colts: Nyheim Hines (RB)
Packers: Aaron Jones (RB)
Bears: Cole Kmet (TE), Jakeem Grant (WR), Darnell Mooney (WR)
10 PERSONNEL
| TEAM | vs BASE | 10P RUN % (vs all Def packages) | 10P PASS % (vs all Def packages) | TEAM | vs NICKEL | 10P RUN % (vs all Def packages) | 10P PASS % (vs all Def packages) | TEAM | vs DIME | 10P RUN % (vs all Def packages) |
10P PASS % (vs all Def packages) |
| Cardinals (1 PLAY) | 0.7%% | 31.80% | 68.20% | Rams | 95.70% | 13.00% | 87.00% | Vikings | 61.10% | 38.90% | 61.10% |
| Lions | 84.90% | 3.00% | 97.00% | Bills | 60.20% | 19.30% | 80.70% | ||||
| Packers | 70.00% | 20.00% | 80.00% | Colts | 60.00% | 0.00% | 100.00% | ||||
| Cardinals | 70.00% | 31.80% | 68.20% | Steelers | 60.00% | 0.00% | 100.00% | ||||
| Jets | 67.80% | 13.30% | 86.70% | Saints | 57.10% | 14.30% | 85.70% | ||||
| Jaguars | 61.10% | 5.60% | 94.40% | Bengals | 57.10% | 7.10% | 92.90% | ||||
| Buccaneers | 50.00% | 0.00% | 100.00% | Buccaneers | 40.90% | 0.00% | 100.00% | ||||
| Bengals | 42.90% | 7.10% | 92.90% | Jaguars | 38.90% | 5.60% | 94.40% | ||||
| Bills | 39.80% | 19.30% | 80.70% | Bears | 33.30% | 0.00% | 100.00% | ||||
| Vikings | 38.90% | 38.90% | 61.10% | Jets | 32.20% | 13.30% | 86.70% | ||||
|
NFL AVG (1 teams above average) |
0.03% (0.04 instances) | 18.70% | 81.30% | NFL AVG (11 teams above average) | 73.23% (15.39 instances) | 18.70% | 81.30% | NFL AVG (12 teams above average) | 26.28% (8.57 instances) | 18.70% |
81.30% |