Analysis
11/11/20
9 min read
Study: Impact of Special Teams on NFL Success
By Robert Simpson and Peter Engler
For NFL fans, the punter is one of the least popular players any given team. If he is out on the field, it means the offense has stalled. But special teams units can have a big impact on the outcome of a game – an impact that is often overlooked. This study attempts to quantify the importance of special teams plays, evaluate the performance of different NFL teams’ special teams units, and find insight into what makes a successful special teams unit.
Punting is the area of special teams that is most predictive of success, so the study will focus primarily on punt units.
The Importance of Punting
Special teams is often an afterthought in football, but the third phase of the game can be highly impactful on a team’s performance. This impact can be measured by using Expected Points Added. Expected Points is predicated on field position. While offensive and defensive performance can play a significant role in the field position battle, the primary goal of special teams (field goals aside) is to obtain optimal field position.
Special teams as a collective term is made up of several similar, but ultimately different, units: punt, punt return, kickoff, kickoff return, field goal/PAT, and field goal/PAT block. To see which of these units is most predictive of success, the EPA gained or lost from these units was compared to a team’s winning percentage using data from the 2016-19 seasons.
The data was run through a multiple regression model with team winning percentage as the response variable. The model was able to predict the winning percentage fairly well, accounting for over 84% of the variation in the data. The findings were a bit surprising, as only punt and punt return units significantly affected winning percentage.
The correlation between punting EPA and winning percentage from the 2019 season can be seen in the graph below. The trendline excludes the three outlying teams from last season (the Bengals, Jaguars and Giants) and accounts for just over 35% of the variability in the data.
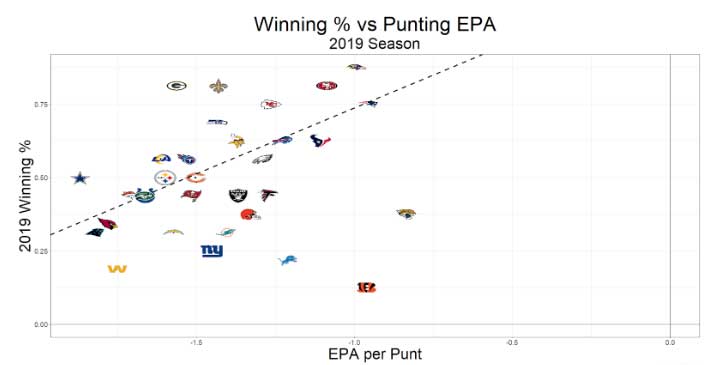
As can be seen from the graph, a significant correlation exists between Punt EPA through the end of the season and winning percentage.
Since punting most significantly impacts winning percentage, the graph below shows how NFL teams have performed on punt and punt return plays through Week 9.
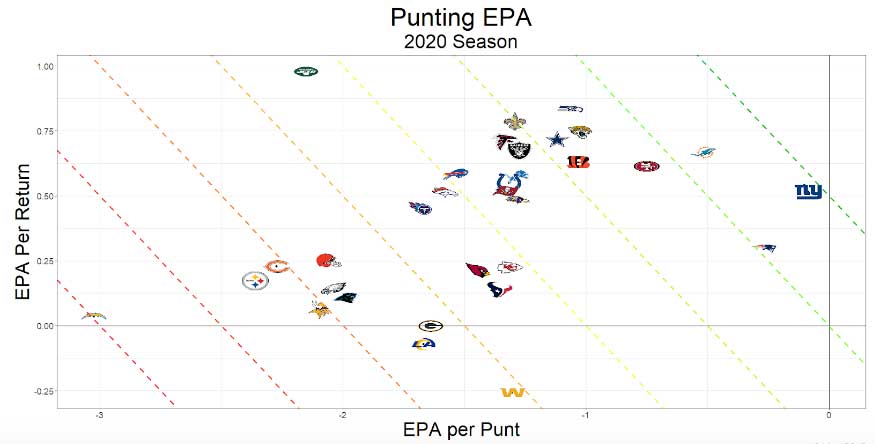
As can be seen from the graph above, the Giants, Dolphins and Patriots have performed the best on punt and punt return teams, while the Los Angeles Chargers have been struggling in these areas throughout the season.
While there’s clearly a difference in the performance of good punt units and bad units, the level of impact punting can have may not be readily apparent from the graph. Thus, the top five units in terms of combined punt and punt coverage EPA were compared to the bottom five, and the results can be seen in the table below.
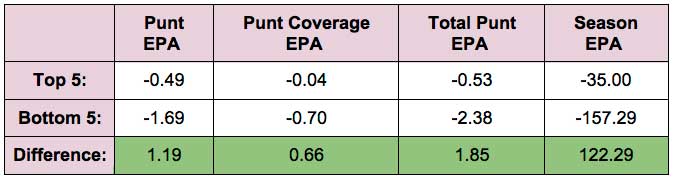
The difference in the performance of the top and bottom units is significant, with the top units averaging 1.85 more EPA than the bottom five every time they punt the ball. While less than 2 points may not seem like a lot, NFL teams punt the ball around 66 times per season on average. Multiplying this 1.85 EPA difference by 66 punts in a season results in the top units gaining over 120 EPA per season more than the bottom units, over 7.6 EPA per game. This discrepancy means that having a good punt unit rather than a poor one can make over a touchdown difference each game.
One point worth noting is that even the top five punt units have a negative EPA per punt. This negative result is because while the rate of teams going for it on fourth down has increased, NFL teams are still not making efficient decisions on fourth down -- punting more often than they should.
The Makeup of Successful Punt Units
While the average fan can’t see special teams past the statistical output, it’s increasingly difficult to tie those statistics to decisions you can make to actually improve your punt units. By looking at how the most successful punt teams make those decisions and then comparing them to the decisions made by the least successful punt teams, it’s possible to find the input decisions that are most important and can become a point of emphasis.
Specifically, we can look at the different components that make up a punt. Everything from snap time, kick type, punting direction and personnel is potentially something that can be improved upon in practice or through different allocations of players on the special teams units. Let’s start with the unit speed, as it’s fairly easy to compute, with the green cells indicating the best values.
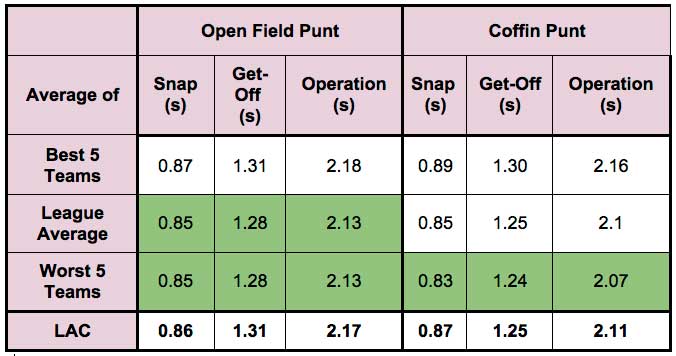
It’s readily apparent that regardless of the specific part of the unit speed, the worst 5 teams by EPA are actually faster across the board in terms of unit speed. As this clearly hasn’t translated to success, unit speed seems to be unimportant. A possible reasoning would be that the worst 5 teams put more of a focus into having a faster-operating unit, while the best 5 teams understand that unit speed doesn’t matter in relation to other teams, it only matters as a threshold to get your punts off unimpeded.
The next avenue of investigation is punt direction and hangtime. As these two factors can be highly dependent on field positioning and your punter’s ability, it’s not apt to compare punt direction across the league, but rather to compare it within a specific team. Additionally, we’re going to only look at open-field punts because coffin punts are fairly straightforward in terms of strategy and come down more to punter skill.
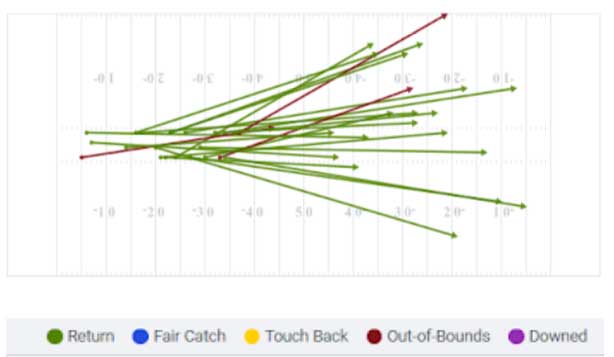
These are the Chargers’ 22 open-field punts through eight games in 2020. They’ve sent the majority (11) to the middle of the field, while the left side has seen eight punts and the right side only three. We can now look at the specific output statistics for each punt direction to see how effective they’ve been.
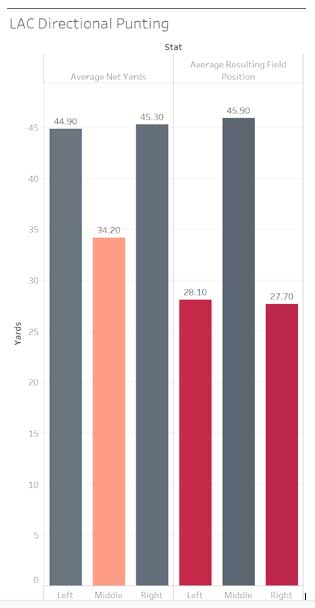
Looking at this directional punting chart, the Chargers’ punts to the middle of the field have a significantly shorter average net yards, but also benefit the opponent on average by over 17 yards of resulting field position. However, don’t immediately assume that the Chargers simply can’t punt to the center of the field. Rather, there’s likely more of a mix of strategy and ability. Returning to the graph of all open-field punts above, the Chargers frequently punt to the middle of the field when they are pinned deep in their own territory, which explains the enormous differential in average resulting field position. However, these punts while pinned back should also lead to a higher average net yards -- yet they clearly don’t.
After looking at unit speed and punt direction, the last great aspect to evaluate is personnel. While every NFL team has a designated punter and long snapper, we’re more interested in the other nine players who make up the unit: the seven coverage players and (generally) two gunners. To speak generally enough to be able to make succinct comparisons between teams, the personnel choices come down to a few questions. First: Do you want bigger and stronger players who can make tackles, or quicker players who can cover more ground in space? Second: Are you willing to risk players who play significant roles on offense or defense? Finally: How much will you invest in these players? By researching the players who have played over 25% of their team’s punt coverage snaps, we can identify a few metrics that give us the best possible objective estimates of how teams answer these questions. Specifically, we can look at Weight, Combine/Pro Day 40-time, Combine/Pro Day Bench, the combined Average Annual Salary, and the number of players who play at least 25% of snaps on Offense or Defense.
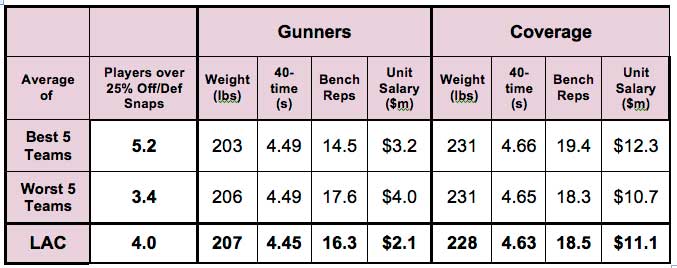
So what are the takeaways here? For one, several of these factors are similar between the best 5 teams and the worst 5 teams, if not exactly the same. For weight and 40 times, there is absolutely no significant difference, indicating that these aren’t factors that lead directly to results.
Moving on to Bench, it seems the best 5 teams actually have weaker gunners, with 3.1 less bench reps, but slightly stronger coverage players. This seems to be a case of the weaker teams overvaluing strength in their gunners.
Third, the unit salary is significantly different between these two groups. The worst 5 teams spend nearly a million dollars more on their gunners -- led by the Bears’ Cordarrelle Patterson at $5 million -- while the best 5 teams spend $1.6 million more on their coverage players, including the Patriots’ six coverage players, each of whom earns over $1.4 million.
Finally, the best 5 teams do indeed feature more players on their punt coverage units who are important contributors on offense or defense. However, it should be noted that this doesn’t translate to putting your star players on every punt snap. By adjusting the threshold percentage to just 40%, only the Patriots and 49ers play more than two otherwise-important players on their punt coverage units -- San Francisco with three and New England at five. The importance of playing your better players on the punt unit is clear. But if this extends to your best players, the top teams in the league have yet to show it.
Summary
Special teams performance, and especially punt performance is highly correlated with team success. While special team performance alone is not going to win a football game, it can make a significant impact on the outcome, with over a touchdown difference between the best and worst punt units. Teams still punt more than they should, but if they do decide to punt, they could improve their performance through higher usage of directional punting and investing more/using higher-impact players at the non-gunner positions.
While teams may emphasize getting punts off quickly in practice, this is more a quality-of-life component and doesn’t actually differentiate between the success of punting units, even when considering blocked punts. Rather, the personnel composition of punt units and the ability to directionally punt is more important. If NFL teams with struggling punt units can make these changes, it could make the difference between winning and losing in close games.