Breakdowns
4/21/21
7 min read
Positional Draft Review: Is the First Player Taken Always the Best?
With the 2021 NFL Draft just a week away, front-office insider Mike Tannenbaum posed the following question: How often is the best player at a position the player who was drafted first among his position group? Tannenbaum immediately pointed out recent examples like Lamar Jackson, the fifth QB drafted in 2018, or Justin Jefferson, the fifth receiver drafted in 2020. It is an interesting and complicated question, especially considering football does not have an industry-wide agreed upon metric, like baseball’s WAR, that can tell us who is truly better.
Pro Football Reference has attempted to create such a metric, which they call Approximate Value. Simply put, Approximate Value (AV) is PFR’s attempt to calculate a player’s seasonal value. It accounts for number of games started/played, Pro Bowl appearances, All-Pros and more. You can read more about the metric and its calculation here: https://www.pro-football-reference.com/blog/index37a8.html.
Given our lack of other metrics to compare players, for the sake of this exercise we have chosen to use AV to determine who has been the “best” player thus far.
To begin to answer this question, we first aggregated draft data from 2010 through 2020 (from Pro Football Reference). For each draft, we gave each player an implied Positional Draft Ranking (Pos Draft Rk) based on the number they were drafted at their respective position. For the examples that Tannenbaum mentioned, Lamar Jackson and Justin Jefferson, both will have a Positional Draft Rank of 5 because they were the fifth players selected at their respective positions. Then, using AV, we ranked each player by position. Jackson and Jefferson both currently rank first at their positions in Career Approximate Value.
A High Level Overview
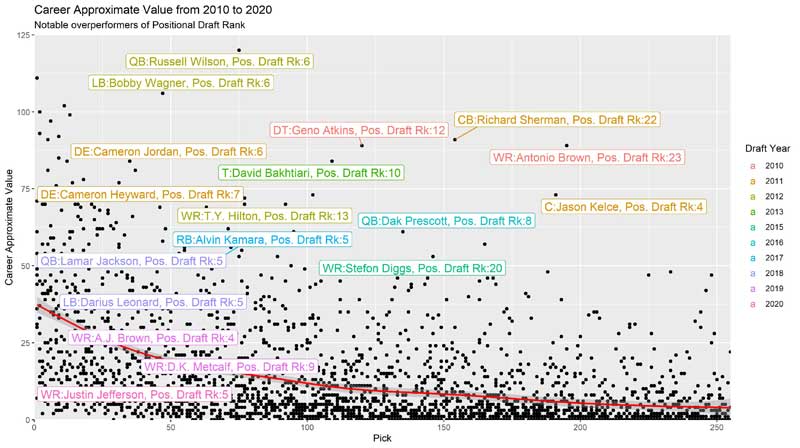
Looking at the draft as a whole from 2010 to 2020, the above chart plots every draft pick during that time and their Career Approximate Value to this point. We have labeled some of the players who have notably overperformed their Positional Draft Ranking. Each label tells us the player’s position and their Positional Draft Ranking. For example, at the top of the chart there is QB Russell Wilson and LB Bobby Wagner -- two players drafted by Seattle in 2012, both of whom were the sixth player drafted at their position. Wagner was drafted in the second round at pick 47; Wilson was taken in the third round at pick 75. Now, almost 10 years into their careers, both players rank first at their respective positions in Career Approximate Value, which is unsurprising given their reputations. We have some other obvious candidates on this chart -- like QB Dak Prescott, who was the eighth quarterback drafted in 2016. One of our biggest overperformers in this entire exercise was WR Antonio Brown, who was the 23rd WR drafted in 2010.
Positional Case Study: Quarterback
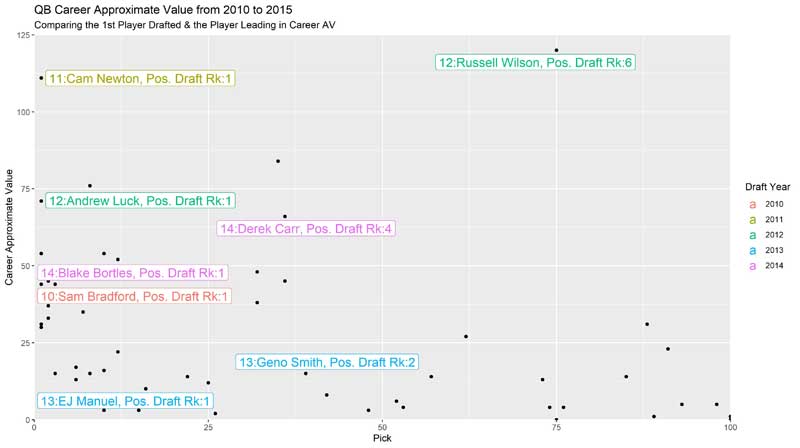
After running through that high-level overview, here are some more digestible case studies by position. First, a case study of QBs drafted from 2010 to 2014:
For each of these charts, I will only be highlighting the players who were drafted first or are the current leader in Career AV at their position. If that happens to be the same player, as it is for Cam Newton in the 2011 draft, then that year will only get one label on the chart. In the above chart, there are only two times in which the first QB drafted has gone on to be the best QB in the draft class per AV: Newton in 2011 and Sam Bradford in 2010. Of note, while Russell Wilson holds the top spot in AV for the 2012 QB class, nobody would question Andrew Luck as the top QB pick.
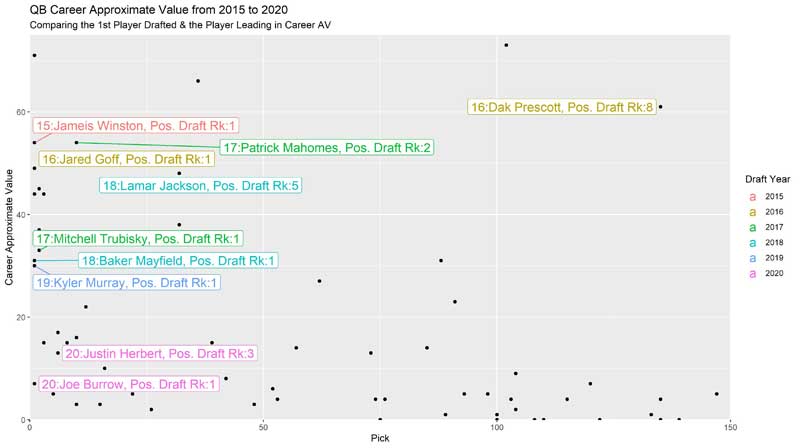
Turning to 2015 through 2020, again only two drafts where the first QB selected is the current leader in AV: Jameis Winston in 2015 and Kyler Murray in 2019. On this chart we can also see the much-discussed Mitchell Trubisky decision and Patrick Mahomes’ explosive start to his career. Finally, it is notable that Justin Herbert played very well last year -- but given Joe Burrow’s injury, it is way too early to tell who is truly “best.”
Positional Case Study: Wide Receiver
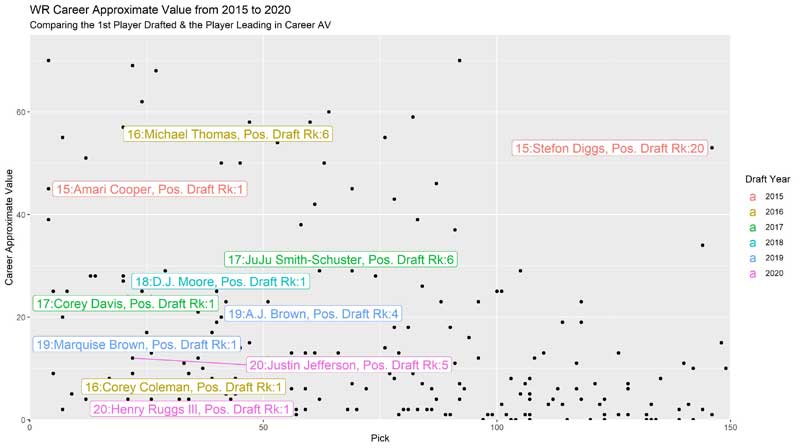
Wide receivers turned out to be one of the most interesting positions. Anecdotally, it seemed that WR, as a position group, has more overperformers than most of the other positions. It is hard to say what is driving this trend, but it could simply be that more WRs are drafted each year than other positions.
There are a few interesting things to note on the above graph. First, there is only one player who was drafted first who is ranked first in Career AV: D.J. Moore from the 2018 draft. Moore was drafted two spots ahead of fellow WR Calvin Ridley and currently has a one-point lead in Career AV. It’s hard to say for certain that Moore is the “best” WR in this class.
Another interesting point to note on this graph is the 2016 draft, where Michael Thomas and Tyreek Hill (not pictured) were the sixth and 18th WRs selected, respectively. Both have been All-Pros, while the first WR drafted, Corey Coleman, has not played since 2018. Finally, it’s worth noting the situation in 2015. Stefon Diggs slightly edges out Amari Cooper that year for the top spot in Career AV. However, no one would say Cooper was a bad pick; it just so happens that a player drafted 19 spots later at that position became just as good a WR if not better.
Positional Case Study: Defensive End
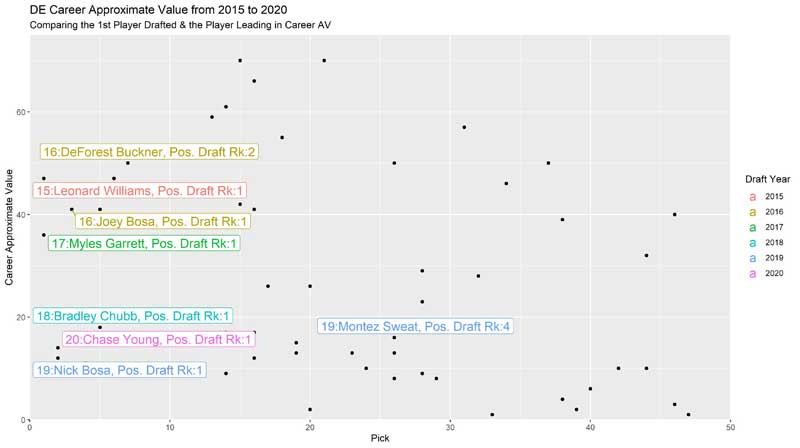
Looking at our first defensive position case study, here the player drafted first actually has been better more often than not. In the above chart, we can see first DEs selected -- like Leonard Williams, Myles Garrett, Bradley Chubb and Chase Young. The two DEs who were taken first but do not rank first at their position, Joey and Nick Bosa, really are lagging behind because of some injury history. Does this tell us that NFL front offices might be better at identifying the top-tier DEs versus positions like QB or WR?
Positional Case Study: Cornerback
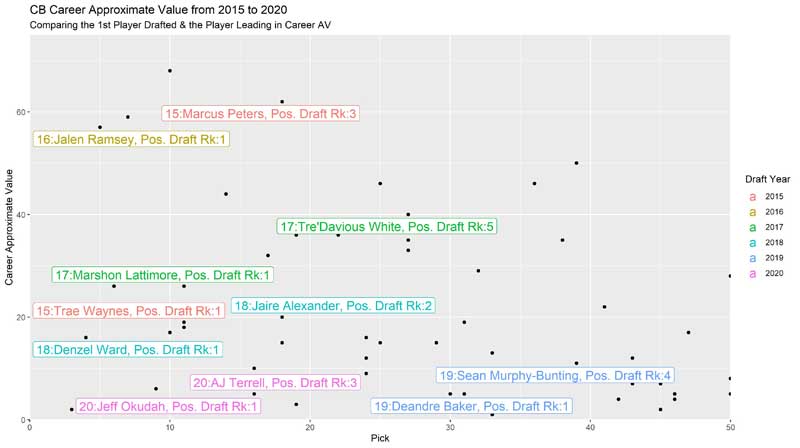
Moving to our second defensive position case study, the cornerbacks look more similar to our other positions. Once again, only once was the CB picked first the best player -- Jalen Ramsey in 2016. There are some interesting battles in this chart such as Marshon Lattimore and Tre-Davious White. Both are fantastic players in their own right; it just happens that the Career AV metric likes White more and he was picked four CBs later.
Preliminary Summary Findings
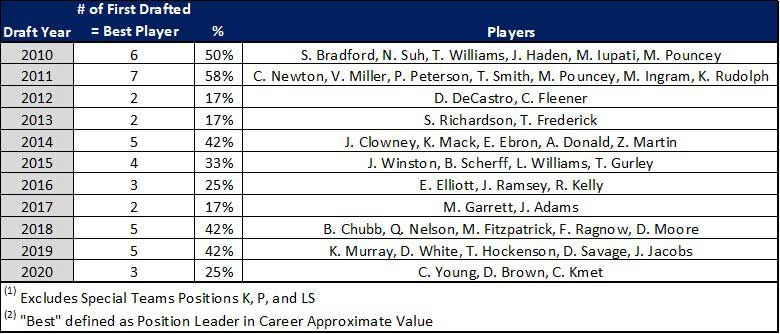
The above chart displays some preliminary findings from this study. We will publish more of these case studies as we dig into the data. In the above chart, we went back to Tannenbaum’s original question: How often is the best player at a position the player who is drafted first among his position group? Answer: Less than you may think.
Of note, there are 15 positions coded into the draft data: QB, RB, WR, TE, T, G, C, DT, DE, LB, CB, S, P, K and LS. Due to some errant data with the special teams players, we are excluding them from the chart. It’s interesting to note that there has only been one draft – 2011 – in which the first player selected at each position has turned out to be the best player more than 50% of the time. The 2011 draft is an outlier, with some stars like Newton, Von Miller, Patrick Peterson and Tyron Smith going in the top 10. On average for the 2010 to 2020 sample, the first player at each position turned out to be the best player about four times -- or 33% of the time.
Front-office decision-makers around the NFL should take note of these findings, especially heading into next week’s draft. If a team doesn’t get the player it was targeting in the first round, it’s not the end of the world. Chances are there is a better player at the position still out there.

