Breakdowns
10/12/20
4 min min read
Study: Do Great Teams Always Blow Out Bad Teams?
When a team we expect to be great matches up against a bad team, we expect a blowout, right? And if a heavily-favored team only wins by a few points, we tend to discount the victory. While this makes intuitive sense, is it accurate? By using point margin to compare the "final four” teams of an NFL season (the participants of the conference championship games) in their games against the unequivocally bad teams (less than 5 wins) for 2010-2019, we can evaluate whether this statement is true.
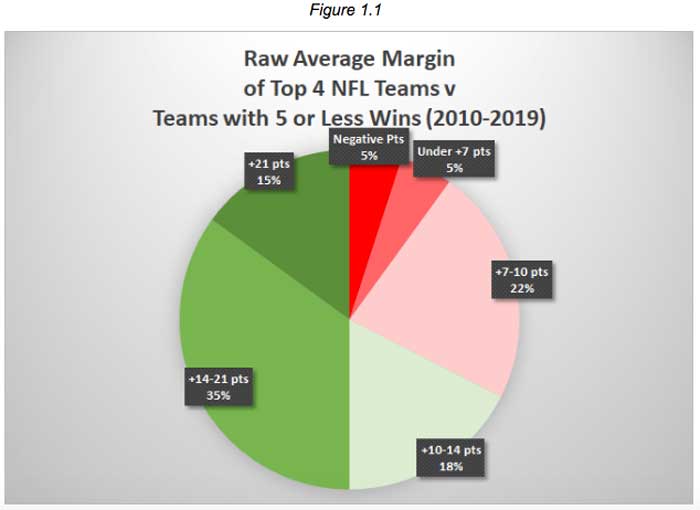
With a cumulative 146-11 record since 2010, we can confirm that these great teams almost always beat bad teams, a thoroughly unsurprising result. However, Figure 1.1 shows the breakdown of the average margin of victory of the top four teams against the bad teams in a season. Exactly 50% of these teams beat bad teams by 2-plus TDs on average -- headlined by the 2015 New England Patriots, who blew out each of Jacksonville, Dallas and Tennessee. However, the other 50% of teams didn’t average these blowouts, with a full 32% not managing double-digit wins. Two teams (the 2019 Titans and 2011 Giants) even averaged a negative point margin, both losing a game (or two) by double-digits to one of the worst teams in the league. Those two examples in particular may raise the (valid) question of how to account for some of the extra factors at play here -- specifically, teams that snuck into the conference title games and all-time bad teams.
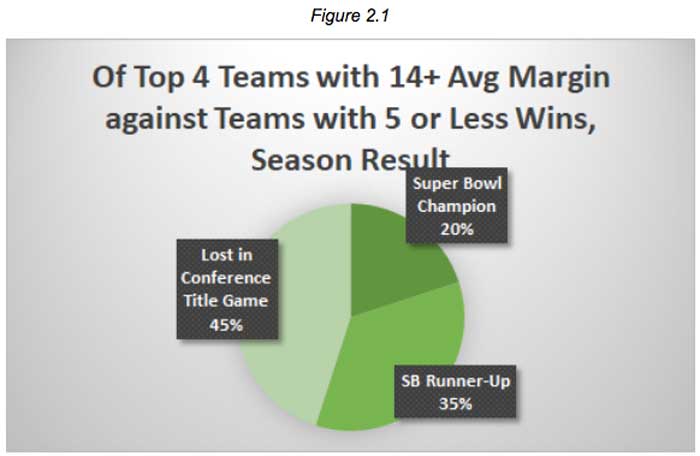
Looking only at those dominant teams from Figure 1.1 (averaged a 14-plus point margin), Figure 2.1 shows that those teams are fairly evenly distributed by their final results. This indicates that the Super Bowl teams, win or lose, didn’t make up an overwhelming majority of the teams that dominated bad teams in the regular season. From this, we can conclude that we properly evaluated what counted as a “great team.”
Still, some of those great teams are better than others, and wins of the same margin aren’t necessarily equal. Take a 21-7 win over a bad team as an example. If the winning team were the 2016 Green Bay Packers (season average margin of victory: 2.8), that’s an impressive win, but if that team was instead the 2013 Denver Broncos (season average margin of victory: 12.9), it’s decidedly less impressive. Figure 3.1, below, shows the difference in the season average margin against the average margin vs. bad teams.
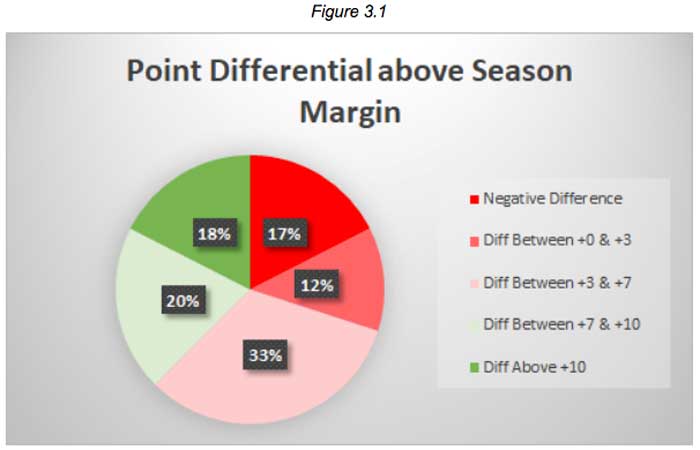
By doing this, we have to adjust our expectations of what a good result is. It’s important to remember that a result of plus-7 on this chart, designated by light green and 20%, means that a team averaged a win against a bad team by a TD more than their full average. For example, with a score of plus-7.0, the 2015 Cardinals actually beat bad teams by 18 points on average, but this is adjusted against their season average margin of 11.0. Using this chart, we see that only 38% of teams matched this extra-touchdown standard, with the majority of teams showing a slight improvement or less against bad teams.
What about the opposite argument? Not all of these bad teams are made equal, with the 0-16 Cleveland Browns of 2017 (with a minus-11.8 season average margin of defeat) clearly not at the same caliber of the 2019 Chargers (minus-0.5), despite both teams recording less than five wins. By making the opposite adjustment, specifically adjusting the average margin by the bad team’s season average margin, we can evaluate whether the great teams are really demolishing the bad teams more than they were already losing. In Figure 4.1 below, this analysis is made.
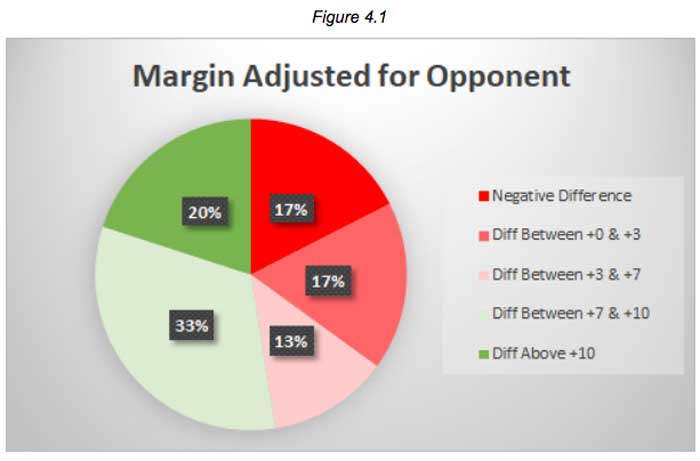
While similar to Figure 3.1, there’s a few new pieces of information to be taken away here. First, slightly over half of the great teams beat the bad teams by over a touchdown more than usual. Second, a vastly smaller margin (15% less) beat the season average margin by between 0 and plus-7. This hints that these great vs. bad matchups rarely go exactly to script -- they’re either close (which would likely fall under “Negative Difference” here), or a larger loss than typical by the bad teams. The answer to this interesting tidbit might be attributed to psychology. When facing a great team, the bad team is more likely to fall into one of two extremes -- either they will be more motivated by the opportunity and subsequently play better, or they will be demoralized by the prospects and subsequently play worse.
Conclusion
So do great teams consistently blow out bad teams? Surprisingly, no. Only 50% of great teams averaged a two-touchdown (or more) win against bad teams, with commonly-cited examples of great teams like the 2019 champion Chiefs and 2014 champion Patriots both failing to clear that bar with so-called “stinkers” in narrow wins against the Raiders and Lions, respectively. Furthermore, only 38% of great teams beat bad teams by seven or more points than their season average margin, while the difference from the season average margin of the bad team hints that it’s actually bad teams that have more input on how lopsided of a game it is. Psychologically, this could be why division matchups between rivals are frequently close regardless of the quality of the teams. So let’s stop knocking our expected great teams for not demolishing every bad team in sight, and instead look closer at what those bad teams may have to offer.