Analysis
6/28/22
8 min read
The State of NFL Free Agency: Part 3
Study by Jamie Kelly
Back in Part 1 of this series, we ran over the rationale for this study of high-profile NFL Free Agent transactions between 2015-2019, the methodology that was used, and presented the results for Quarterback, Running Back, Wide Receiver, and Tight End.
In Part 2, we dug into the Offensive and Defensive Lines, and now in Part 3, we’ll dive into LBs and DBs.
Linebackers (Off Ball)
Overview
From a college perspective, this LB group comes from two distinct poles. You’ve got players from powerhouse colleges like LSU, Alabama, Michigan, Oklahoma, and Texas, to a handful of players from smaller schools like Arkansas State and Mary Hardin-Baylor. This results in a somewhat predictable wide spread of draft status too.
Most of this group fall into the 414 club (4 NFL seasons, for 1 team, for 4 NFL seasons aka the typical rookie contract), only 5/17 had played for more than 6 seasons and for 2 or more NFL franchises. The average age of LBs included in this study at signing was 27 ½.
LB FA Statistics
- 2 of the 17 players included in this study completed their FA contract (including Demario Davis to NO who has since negotiated and does NOT include CJ Mosley who has yet to be released or complete his contract)
- Only 2 of the 17 players was still on the acquiring team the year after his contract ended (Danny Trevathan, Demario Davis)
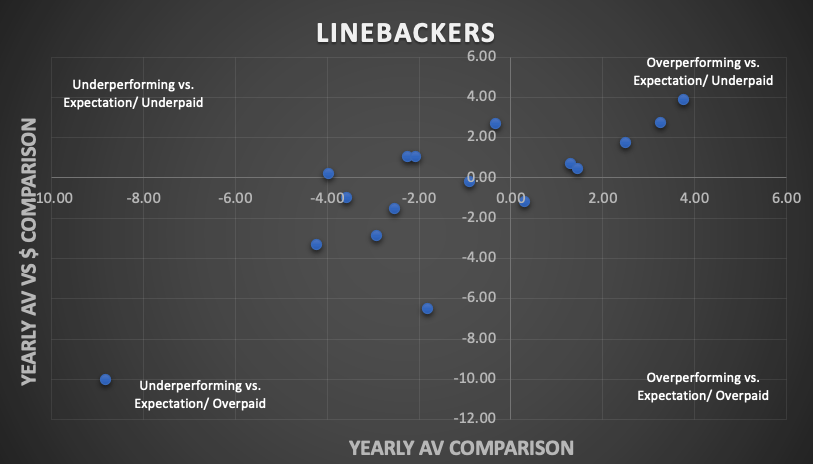
- 6/17 had positive Yearly AV vs expectation values – showing clear trend that OL improve with age
- 9/17 had positive Yearly AV vs $$$ expectation values
- - 1.23 Yearly AV vs. expectation for the whole group
- - 0.69 Yearly AV $ vs. expectation for the whole group
When do LBs work out?
What the LB receives in Free Agency in new contract value has shown to be an indicator of success in this study. Of those with positive yearly AV comparison and yearly AV vs $ expectation grades, they received a contract with an average of 2.8 years and total value of $18.47m. For those with negative grades this was an average of 3.875 years and $34.5m.
Prior production is a bit over the map with low producers performing post-FA in some but not all instances, and some pre-FA stars failing to shine after their new contract is signed.
When do LBs NOT work out?
Size/ profile of LB appears to be a factor. Of those with negative yearly AV vs $ expectation grades, the average weight of those players was 237.5 pounds vs. 232 for those with positive grades. In the NFL, lighter, nimbler LBs are the trend so this appears to reflect this ongoing movement.
Best FA signing
Demario Davis to NO in 2018. Demario Davis’s two FA transactions, first to CLE in 2016 and then to NO, are both in the top 3 for yearly AV vs. $ expectation so he’s certainly shown to be a reliable performer. After signing a sound, 3yr, $24m contract with NO, he produced a very good 2 year run averaging 10.5 AV a year, before earning an extension at improved pay. His yearly AV comparison post-FA was an impressive 3.76, and his yearly AV vs $ expectation topped out a very respectable 3.90.
Worst FA signing
Malcolm Smith to SF in 2017. The Former Super Bowl MVP, had already bounced to OAK/LV before signing a 5yr, $26.5m contract at age 28 with SF. He was unable to live up to his Seahawk highs, as his yearly AV decreased by 2.94 and his yearly AV vs. expectation was a disappointing -2.87. His two-year run with the team ended in being released.
Cornerbacks
Overview
As with LBs, we see a wide spectrum of entry routes for our list of 30 CBs. We have players who were first round picks from Alabama, Florida and South Carolina to late-round, small school stars from Chattanooga, Grand Valley State and Shippensburg.
It’s one of the surprisingly older groups covered in this study, with the average age of signing at 28 ½, and an average of 5.66 pre-FA NFL seasons.
The CB group also saw one of the biggest disparities between the two metrics with yearly AV vs. $ expectation being very low when compared with yearly AV comparison. This is likely due to AV scores for CBs not equaling the worth of the contracts currently being paid out to them in the market. This isn’t to say they are not worth it however, as AV is just one method of performance record.
CB FA Statistics
- 8 of 30 players included in this study completed their FA contract (or renegotiated for higher pay)
- 5 of the 30 players was still on the acquiring team the year after his contract ended
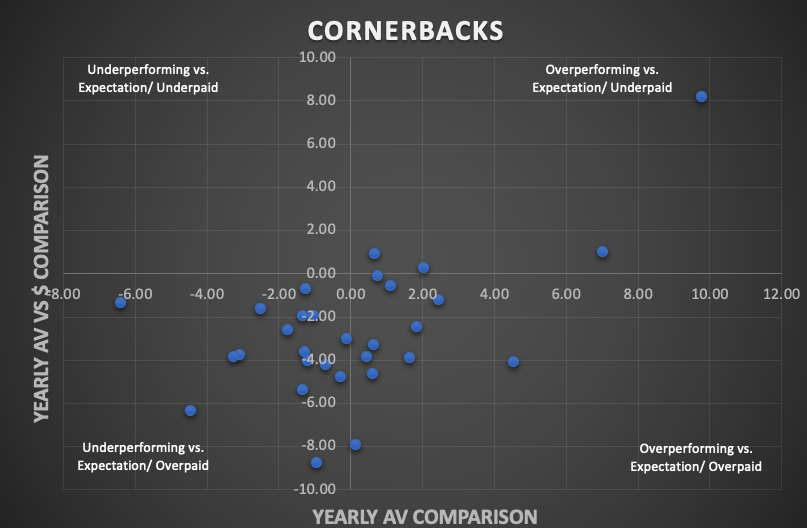
- 14/30 had positive Yearly AV vs expectation values
- 4/30 had positive Yearly AV vs $$$ expectation values
- + 0.09 Yearly AV vs. expectation for the whole group
- - 2.63 Yearly AV $ vs. expectation for the whole group
When do CBs work out?
Youth generally appears to be a positive determiner of success. For those with positive yearly AV comparison scores, they averaged 5.14 pre-FA NFL seasons and 50.5 starts vs. 6.125 pre-FA seasons and 62.625 starts for those with negative results.
Lowly Pre-FA career earners also generally seem to show improvement post-FA. Of the top-8 in yearly AV comparison, 7 had earned $3.5m or below to that point in their career (Stephon Gilmore was the exception with a $23m+ pre-FA earnings).
However, on the flip side, higher earners tend to be a little closer to the mean when it comes to yearly AV vs. $ expectation. The top 14 scorers in AV vs. $ expectation had a pre-FA earnings average of $23.6m, whereas the bottom 10 scorers in the same metric had a pre-FA earnings average of $10.4m.
When do CBs NOT work out?
A higher-than-average height may be a negative factor for FA CBs working out. Only 1 player with a positive AV comparison score (Cary Williams) had a height above 6005, and no player with a positive score was over 6012.
Best FA signing
Casey Hayward to LAC in 2016. A 3yr, $15.3m contract at age 27 turned out to be an absolute bargain for the Chargers. Not only did he increase his yearly AV post-FA by 9.78 vs. pre-FA, his 8.19 yearly AV vs. $ expectation was also one of the best included in the entire study. He earned a pay rise after year 2 of this deal and has continued to be a very solid NFL corner.
Worst FA signing
Robert Alford to ARI in 2019. An inconsistent but flashy spell in ATL led to a 3yr, $22.5m contract in ARI, but the results were massively disappointing with Alford generating 0 AV over a 2-year span before his release.
Safeties
Overview
The Safety group included in this study, is one of the more mature with an average of 6.42 pre-FA NFL seasons and 91.5 average pre-FA games.
It’s a group with plenty of star performers, the average of the 26 player’s individual pre-FA single high in AV was 8, with 11 having a single-season high over 10.
As with other groups there is a scattering of high and low draft picks. We had 3 first rounders and 8 second rounders, with 6 UDFAs at the other end of the spectrum.
Primarily this group came from the Power 5 colleges, with only 5 of the 21 attending colleges outside of the traditional Power 5 conferences.
Safety FA Statistics
- 5 of 26 players included in this study completed their FA contract (includes Adrian Amos who is yet to complete the term on his FA contract)
- Only 3 of the 21 players were still on the acquiring team the year after his contract ended
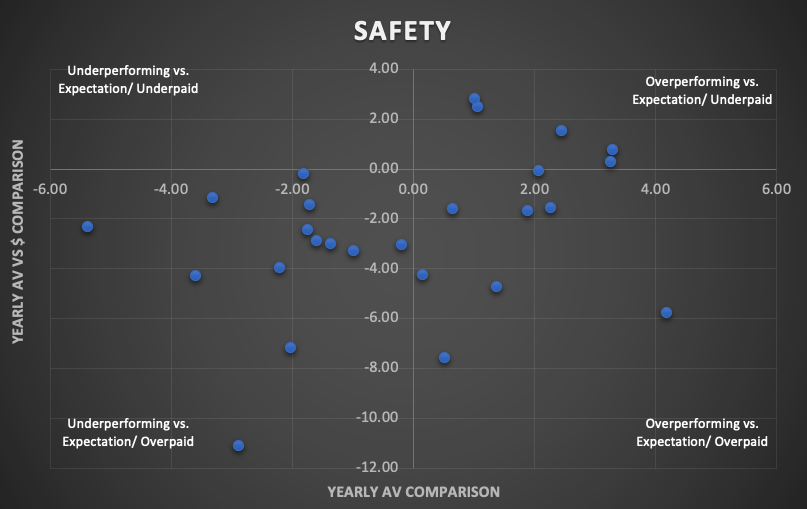
- 13/26 had positive Yearly AV vs expectation values
- 5/26 had positive Yearly AV vs $$$ expectation values
- - 0.18 Yearly AV vs. expectation for the whole group
- - 2.51 Yearly AV $ vs. expectation for the whole group
When do Safeties work out?
Younger Safeties tend to have a better post-FA Yearly AV Comparison than their older peers. The group with a positive yearly AV comparison played 5.30 pre-FA NFL seasons, vs. 7.53 for those with negative grades.
Age did turn to a positive when it came to value. The top 2 in yearly AV vs $ expectation (Reggie Nelson and Eric Weddle) were both over 30 at the time of signing.
When do Safeties NOT work out?
Prior success is shown to be an important factor in if the player will be able to play to the contract value. Whereas the top 8 in yearly AV vs. $ expectation was 5.40 in pre-FA yearly AV, the rest averaged out to 5.27 and that’s with high outliers such as Earl Thomas (off-field issues) and Landon Collins included in the lower scoring group.
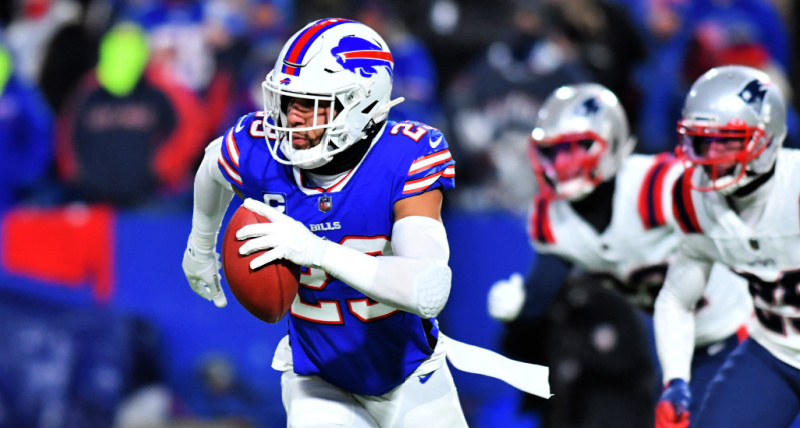
Best FA signing
Micah Hyde to BUF in 2017. While he had a solid stint in GB after being drafted in the 5th round, Hyde truly blossomed when he got to BUF, living up to his 5yr, $30.5m contract. His yearly AV jumped by 3.28 and his yearly AV vs. $ comparison finished above the line at 0.87.
Worst FA signing
Landon Collins to WAS in 2019. His pre-FA stint in NYG would have suggested this should have worked out, but it wasn’t to be. His massive 6yr, $84m contract in Washington became a significant weight for the team to carry. His yearly AV decreased by 2.89 after his signing and his yearly AV vs. $ comparison was a costly -11.09.
We’ll complete this study in part 4, where we’ll be evaluating how individual teams have done across all the transactions included in this study.