NFL Analysis
3/27/22
8 min read
Using Statistical Modeling to Rank Quarterback Prospects
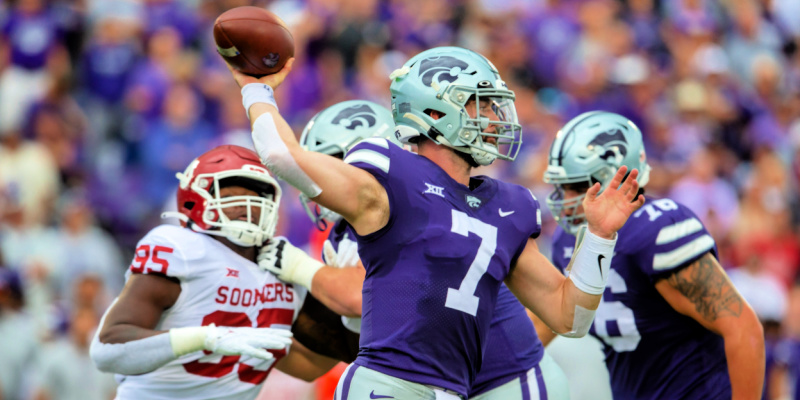
The 2022 quarterback class is interesting because there is decent variation in media outlets’ rankings, and we do not have a solid idea of where the first quarterbacks will be selected. In 2021, it was obvious that 5 quarterbacks would be selected in the first round, and Trevor Lawrence and Zach Wilson were known to be the first 2 picks by the beginning of March.
The goal of this exercise is to add a data point in the large amount of information that goes into ranking quarterback prospects. This is not meant to take precedence over or be a replacement for scouting. However, we will see how the two modeling approaches used can give us some useful information.
Note: this article will get slightly technical until the final section with rankings.
Models and Feature Selection
The variable we are trying to predict is PFF grade over a player’s first 4 seasons in the NFL. Although PFF grade is not a perfect encapsulation of QB play, it has been shown to be highly correlated with team success and expected points added. Also, PFF grade can factor into rushing success, while EPA per dropback misses out on QB runs and EPA per dropback plus designed QB runs would be misleading due to the large discrepancy in efficiency between pass and run plays.
The data chosen for the models include production data on standard passes (RPOs and screens removed) and athletic testing data from the NFL combine. The list of features considered is as follows:
Production Data
- PFF Passing Grade
- Completion %
- Yards per Pass Attempt
- Big Time Throw Rate
- Turnover Worthy Play Rate
- Sack Rate
- Scramble Rate
- Average Depth of Target (ADoT)
- Average Time to Throw
- Play Action Rate
- PFF Rushing Grade
- Yards per Rush Attempt
- PFF Passing Grade in Best College Season
- Binary indicator of whether QB’s grade improved each year in college
- Seasons with significant playing time
Athletic Testing
- Height
- Weight
- 40 Yard Dash
- Vertical
- Broad Jump
- 3 Cone
- Shuttle
Model Comparison and Analysis
The models used include a multiple linear regression on the significant predictor variables and a tree-based model using XGBoost.
| Linear Model | Tree-Based Model | |
| Training mean absolute error | 7.7 | 3.03 |
| Testing mean absolute error | 10.1 | 16.5 |
| R-squared | 0.24 | N/A |
The testing mean absolute error means that when used on the testing dataset, the model’s prediction of 4 year PFF grade differs from the actual 4 year PFF grade by an average of 10.1 points for the linear model and 16.5 points for the tree-based model. These errors are large, but predicting performance of QB prospects is a difficult task.
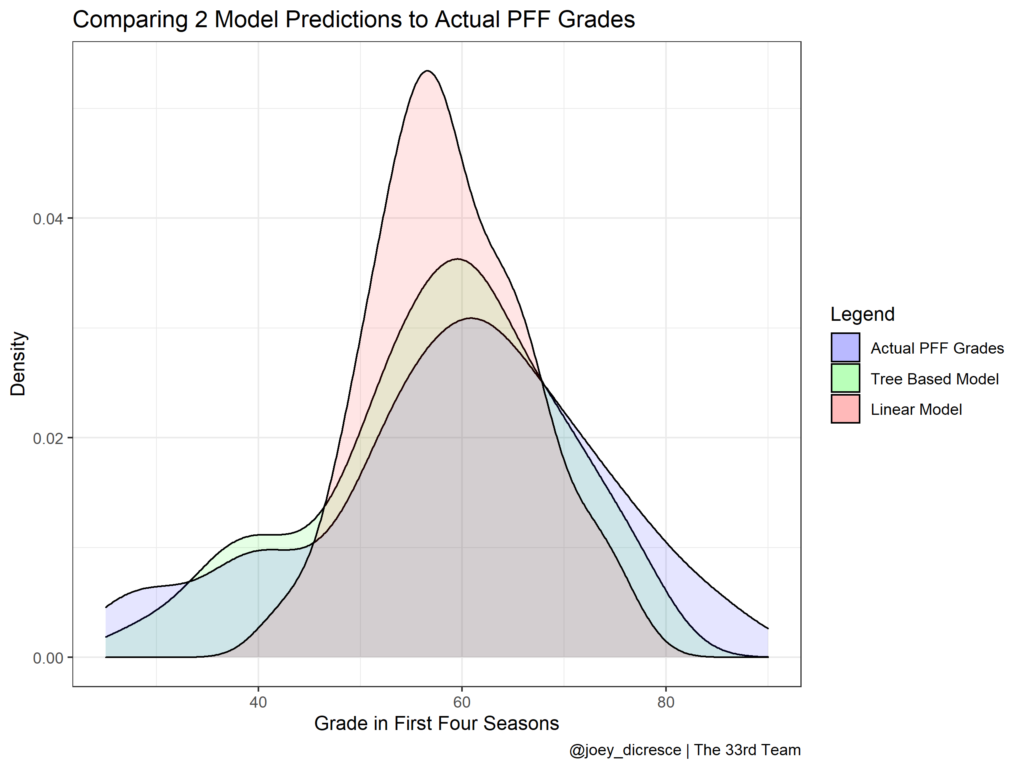
In the graph above, we can see the distribution of the model predictions along with actual PFF grades. The linear model is more conservative and typically predicts closer to the mean. The tree-based model has higher bias towards its training data, and more closely mimics the actual distribution. However, this does not prove that the tree-based model would match this distribution well on new data. Both models struggle to predict extreme high-end and extreme low-end production, although outliers are typically the most difficult to predict. Even though we are not able to accurately predict the grade of the outliers, the models can help us identify bottom and top-tier QBs through f the rankings of their grades.
Out of the top 25% of quarterbacks of actual grades, 54% were in the top 25% in terms of the linear model. Out of the bottom 25% of actual grades, 45.8% were in the bottom 25% of the linear model’s rankings. Furthermore, the linear model did not incorrectly place any top 25% QB in the bottom 25% or a bottom 25% QB in the top 25%. We should note that this is using training data; however, this is encouraging that the linear model can do a decent job at ranking QBs. This may provide evidence that some players will not become stars if they rank poorly and that other players are unlikely to become tremendous busts if they rank highly.
When interpreting the linear model, rushing grade was one of the significant predictors. This means that rushing production in college is more predictive of rushing success in the NFL than college passing production is of NFL passing production. Scouts would likely confirm this theory. Completion percentage, passing grade, and sack rate were also some of the significant predictors.
Now to analyze the tree based model, the analysis of the top and bottom 25% done previously for the linear model is not informative in the gradient boosting model because of overfitting in the training dataset. The tree based model has a high testing error and seems to be unreliable because of its lack of data. Only about 7 QBs are drafted each year, and it is not likely that more than 4 get significant playing time. Therefore, this lack of data makes this a hard problem to solve.
Another factor to consider is the diverse range of QBs that have had success recently. For example players like Justin Herbert, Patrick Mahomes, and Josh Allen did not have the most impressive statistical profiles coming out of college and yet the three have been the most productive, young QBs in the NFL. The traits and potential those three QBs had may not be easily found when looking at just numbers. However, because of the nature of the tree-based model, it will effectively value QBs with similar statistical/athletic profiles to QBs that have had success in the NFL. Thus, the usefulness of the tree-based model is the significant predictor variables to prove what varies the most amongst high-performing QBs. The graph below displays how the decision trees in the model were improved when adding the specified feature.
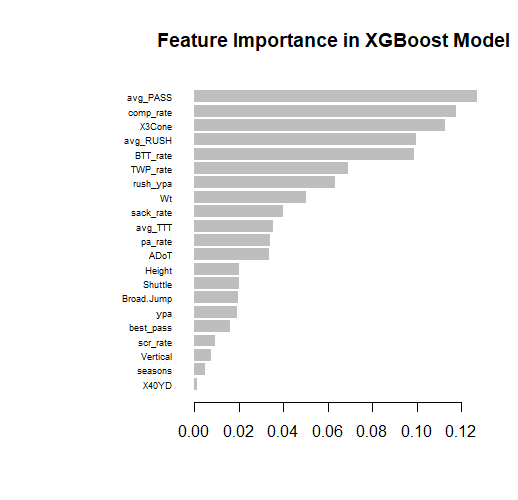
Note that the top 5 significant predictors in terms of gain, or how much they improved decision trees when added, were pass grade, completion percentage, three cone time, rush grade, and big time throw rate. However, this does not necessarily mean that these values have a strictly increasing/decreasing relationship with NFL grade. Because of this, this model is likely not very useful in predicting QB performance in its current state, but with more data it could be quite useful though. The model was still included here because it can provide insight as to which QBs had similar statistics and athletic scores with recently successful QBs.
Rankings
Based on the models’ fits, the linear model is more informative than the tree-based model in this case. With the unpredictability of selecting QBs and a relatively low amount of data, these models only performed well enough to be another data point in an evaluation. The rankings should be an aid to an evaluation, not the whole evaluation.
Now, we can take a look at how the model’s rankings stack up against one another and with scouting big boards. The consensus rankings are compiled by Jack Lichenstein and can be found here. The 33rd Team Rankings and in-depth scouting reports for over 250 players can be found here.
| Rank | Consensus Media Big Board | The 33rd Team | Linear | Gradient Boost / Tree | DiCresce's Rankings |
| 1 | Kenny Pickett | Kenny Pickett | Malik Willis | Skylar Thompson | Malik Willis |
| 2 | Matt Corral | Malik Willis | Brock Purdy | Matt Corral | Desmond Ridder |
| 3 | Malik Willis | Sam Howell | Matt Corral | Desmond Ridder | Matt Corral |
| 4 | Desmond Ridder | Dustin Crum | Desmond Ridder | Brock Purdy | Kenny Pickett |
| 5 | Sam Howell | Desmond Ridder | Jack Coan | Kenny Pickett | Sam Howell |
| 6 | Carson Strong | Carson Strong | Dustin Crum | Jack Coan | Carson Strong |
| 7 | Bailey Zappe | Matt Corral | Sam Howell | Malik Willis | |
| 8 | Skylar Thompson | D'Eriq King | Bailey Zappe | Sam Howell | |
| 9 | Jack Coan | Jack Coan | Kenny Pickett | Dustin Crum | |
| 10 | Brock Purdy | Skylar Thompson | Carson Strong | Carson Strong |
Malik Willis’ strong rushing production and high big time throw rate on standard dropbacks help make him rank first in the linear model’s predictions. This solidifies the belief that Willis is one of the top QB prospects.
Kenny Pickett posted a 90+ PFF grade in his senior season but struggled in previous seasons. Based on the linear model, career average passing grade is more critical than passing grade in a player’s best season. With this information, along with the lowest big time throw rate among QBs listed above, and little rushing production, Pickett comes in lower than expected.
Matt Corral and Desmond Ridder perform well in both models, which does establish more confidence in their rankings. It may be worth further questioning why lower projected players Sam Howell and Pickett are often ranked above them.
Skylar Thompson ranking first in the gradient-boosting model may not be significant, but it may be worth further investigation into his film.


