Analysis
5/20/21
3 min read
Using ASI to Project FBS Players
Prior to the NFL Draft, we introduced the Athletic Success Indicator (ASI), a metric to project performance in the NFL based on combine and pro day testing numbers. A similar methodology can be used to predict which high school players have the athleticism to play at the FBS level.
For a point of comparison, publicly available data was used from the 2012 Nike SPARQ Combine Series. The participants in these combines had their height, weight, 40-yard dash, shuttle and vertical jump recorded. From these measures, four other metrics were calculated, which were as follows:
- Body Mass Index (BMI): The ratio of a player’s weight to height
- Speed Score: 40-yard dash adjusted by player’s weight
- Height-Adjusted Speed Score: 40-yard dash adjusted by player’s weight and height
- Vertical Jump Power: vertical jump adjusted by a player’s weight
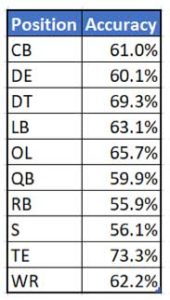 These nine combines measurements, as well as a player’s position, were then used in a machine-learning model to predict whether that player would play at the FBS level.
The accuracy for the model varied by player position, though each was 55.9% accurate or better, with the highest accuracy achieved of 73.3%. The accuracies for each position can be seen in the table to the right.
Accuracy of each model could have been greatly improved with the inclusion of extra measures, such as the broad jump, bench press, and 10-yard and 20-yard splits. Unfortunately, there was limited publicly available data for this study.
Predicting Future Prospects
Once the model was trained off past data, measurements from current high school athletes could be used to project their chances of playing in the FBS. This new data was from the 2021 Rivals Combine Series in both Dallas and Miami, as results from both are publicly available on their website.
It is worth noting that many of the top-ranked high school recruits who participated in these events were not included in the dataset, as the recruiting service Zcruit removes their testing numbers and sells them to individual college programs. Thus, most of the remaining recruits can be considered under the radar and may not have as many offers as their testing numbers suggest they should.
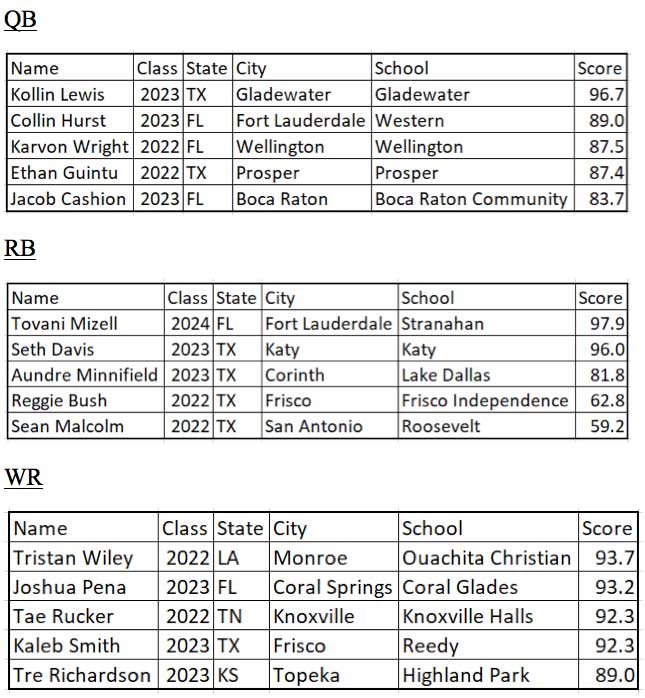
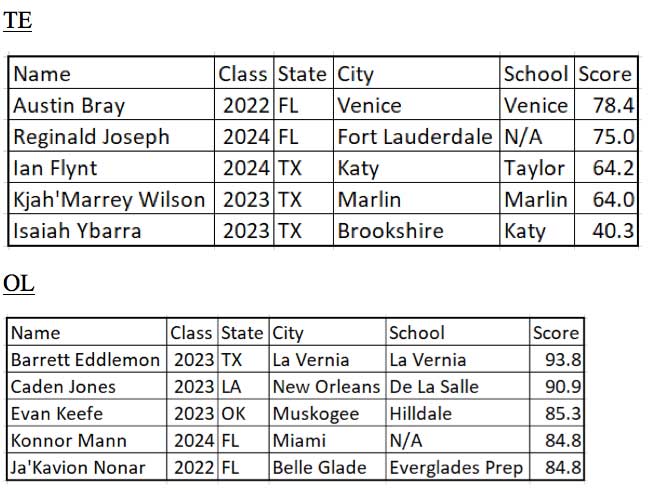
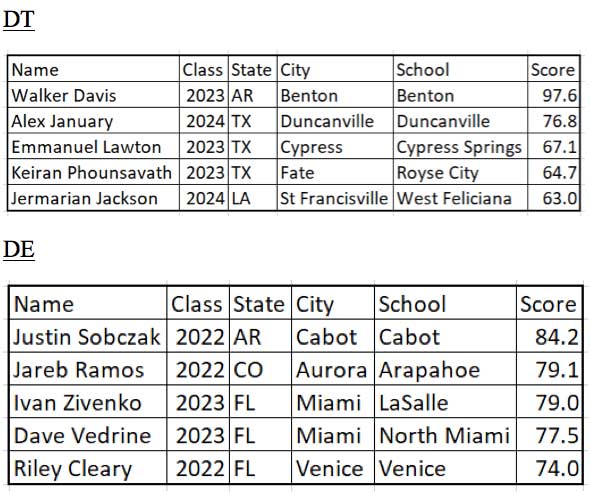
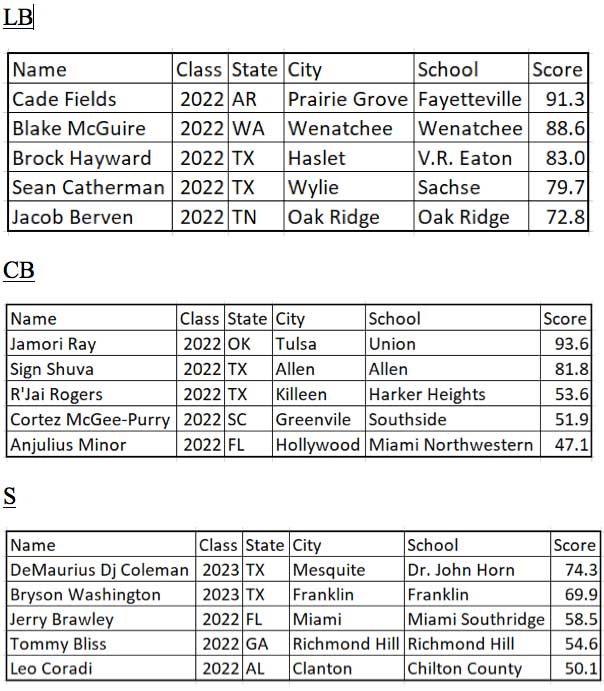
For each high school prospect, their percent chance of playing at the FBS level was predicted and then scaled from 0-100 within their position. Thus, the player with the highest chance of playing at the FBS level at each position would score a 100, while the player with the lowest chance would score a zero.
Below are the top 5 scorers for each position group:
Conclusion
High school testing data can be messy, as the bodies of many of these athletes are still maturing and there can be a large amount of variability in the level of training high schoolers have received to prepare for these events. Some of these top-ranked athletes are as young as freshmen and sophomores, so their numbers can change significantly as they develop. Nonetheless, with the accuracies produced by the model, it shows that there is a correlation between high school testing numbers and the ability to play at the FBS level. With analytics slowly being accepted in college recruiting offices, it will be interesting to see how the importance of high school combine testing will grow in the coming years.


