Breakdowns
5/10/22
9 min read
The Impact of Dead Cap and Injuries on NFL Success
Study by Jamie Kelly
The NFL is a rare league in the world of sports in that it operates a true, hard salary cap. While you may hear some exclaim that there is “no cap” or the “salary cap is fake” this insight by our co-founder, Joe Banner, and what’s to follow in this study should encourage you to be skeptical of those hot takes and reinforce the importance of NFL teams working effectively under the salary cap confines to deliver success.
In the NFL, putting together a team is ultimately a fine balance of resource allocation with draft picks and salaries. How well a team balances these finite resources is the determining factor in short- and long-term success.
To examine if the thesis is correct, we’re going to study a metric we call ‘Lost Cap,' a catch-all for all salary cap hits that result in lost productivity versus the cap. These negative effects include Dead Cap penalties, Injured Reserve (IR) Cap hits, PUP/Reserve designations, and Suspensions. We’ll then look at these numbers against how each team performed over single and multiple seasons to show which teams did the best job.
Study Methodology
We decided to focus on a three-year period between 2019 and 2021 so we could gather multiple years of team salary cap data. To build the dataset, we used Spotrac and their team-by-team salary cap breakdowns and for team success data we used Pro Football Reference’s wide supply of data.
It’s important to know that throughout this study we used the team’s adjusted cap as ‘their’ salary cap for each year, not the official yearly salary cap. The adjusted cap considers previous year rollover, allowing a team to spend potentially more in each season if they’ve underspent in season’s prior.
To assist with following along, here’s an additional quick glossary of terms we’ll use in this study:
- Injured Reserve – cap hit associated with a player not playing because of injury
- Physically Unable to Perform (PUP) – another designation used for injuries typically used by teams on players with short-term (6-10 week) injuries
- Non-Football Related Injury – a separate designation the NFL uses for these types of injuries/absences
- Suspensions – Cap hit for players while they’re serving a ‘without pay’ league suspension
- Dead Cap – this summarizes cap hits for released or traded players – this is because all signing bonuses in the NFL count against the cap, at some point – if a team signs a player with a $10m signing bonus on a 5-year contract, pro-rates that over the 5-years ($2m a year) and subsequently releases him after say 3 years, a dead cap hit of $4m (2 years x $2m) will apply in that upcoming season’s salary cap (except if it’s a June 1 exception in which case it would spread the dead cap hit over 2 seasons rather than 1)
- Lost Cap – A total of all the above factors
Overall Findings
Successful NFL Teams Maximize Available Resources
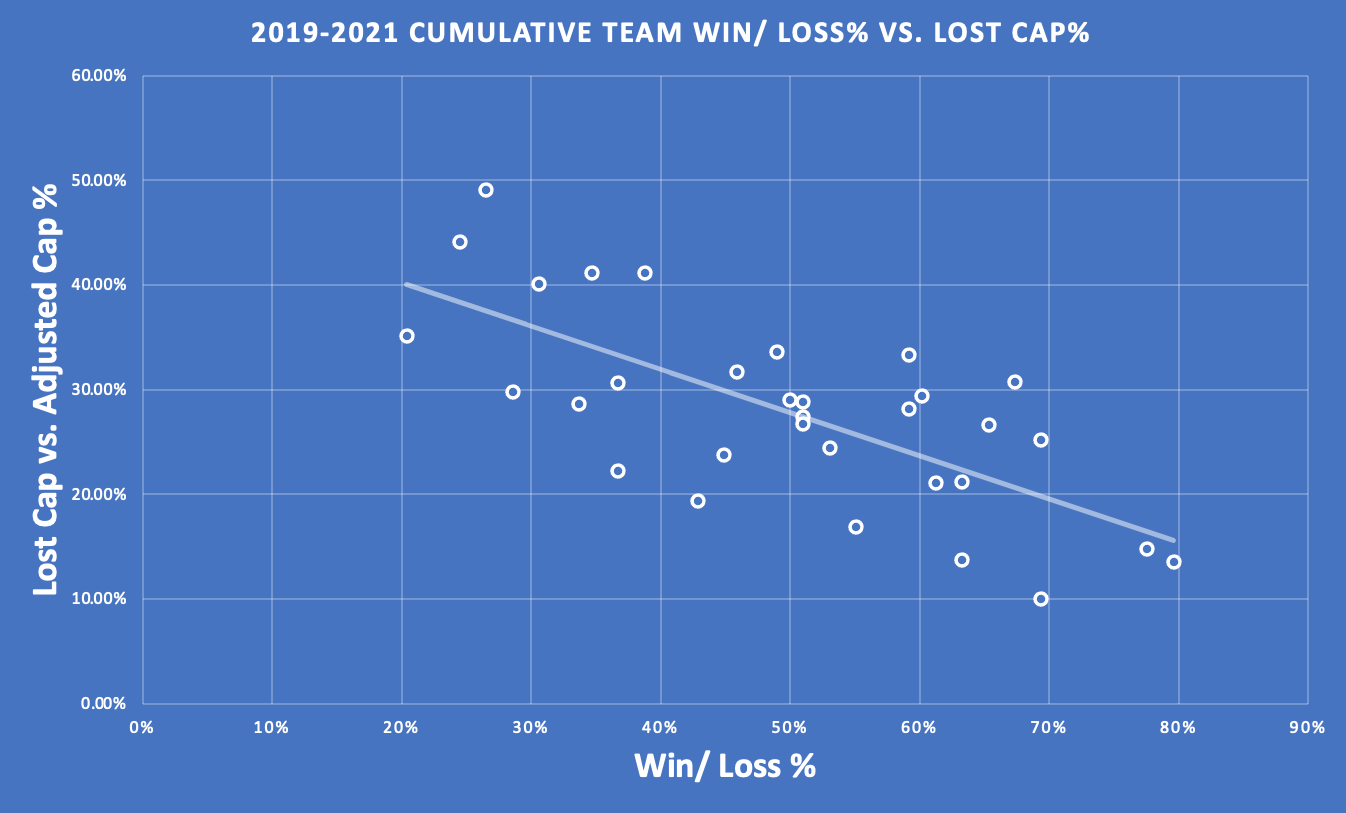
It shouldn’t come as a surprise that the most successful NFL teams are the ones that minimize lost productivity the best. Let’s visualize this in two charts, with Fig.1 showing a scatter graph of all 2019-2021 team’s Lost Cap% (Lost Cap x a team’s own Adjusted Cap) on the Y axis, and the respective W/L record on the X.
Fig.1
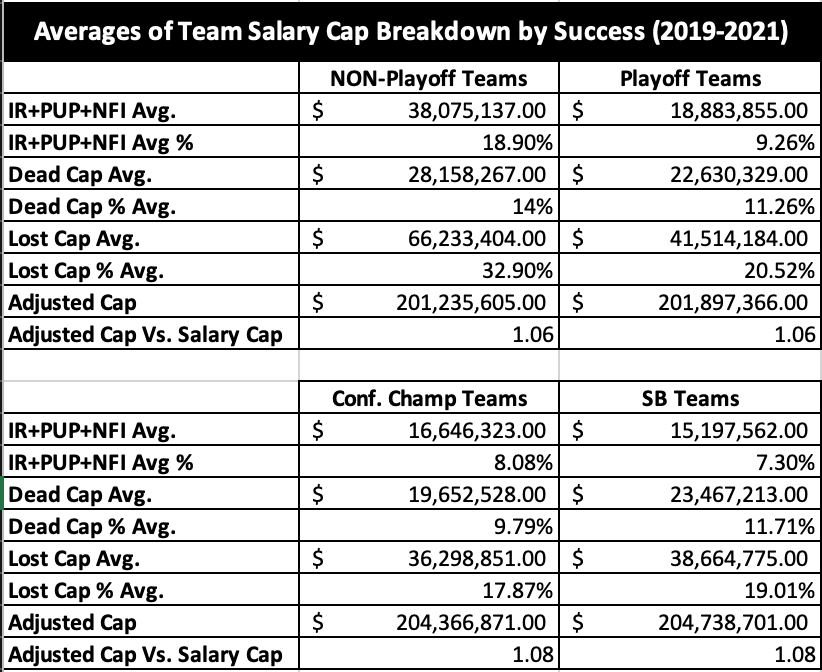
In Fig.2 we’ve categorized all individual seasons between 2019 and 2021 by playoff success and averaged out the respective numbers for each category.
Fig.2
Through looking at Fig.1 we see a clear correlation between W/L% and the amount of Lost Cap a team incurs. No team over that time frame has won over 40% of their games with a Lost Cap % (Lost Cap vs. Adjusted Team Salary Cap) rate over 48% and no team has lost more than 50% of their games by maintaining a Lost Cap % rate under 10%. In any given year if you have more resources (cap space/ players active on field) the evidence clearly shows you’re in a better spot to win football games.
Now, let’s look at Fig.2 and we again see a clear downward trend from the NON-playoff teams, to the playoff teams, to the teams that make it to the conf. championship, across the board in terms of Dead Cap and Injury/NFI hits. For example, looking at the average Lost Cap % for Non-playoff teams at 32.9% vs. Championship Game teams at 17.87%, an amount circa $29m in utilized cap space, and it’s clear to see the resource disparity that the successful teams had over the others. There’s also a common trend with the available adjusted cap going up with success, with SB teams on average having $2.5m more to spend in that season than NON-playoff teams.
We do see a small trend break when including SB appearances in both the above charts. This can be put down primarily down to a small sample size of 6 teams, which included the 2021 LA Rams (a team that carried Jared Goff’s huge $24.7m cap hit) that skew the continuing downward trend we’d expect to see if we ran this survey over an extended period.
Sustainable NFL Success Comes Through Effective Salary Cap Management
These trends also show up when we look at team performance and their salary cap management cumulatively over this three-year period. In Fig.3 we’ve mapped the results just as we did with Fig.1 except taking the three-year horizon instead of each individual season.
Fig.3
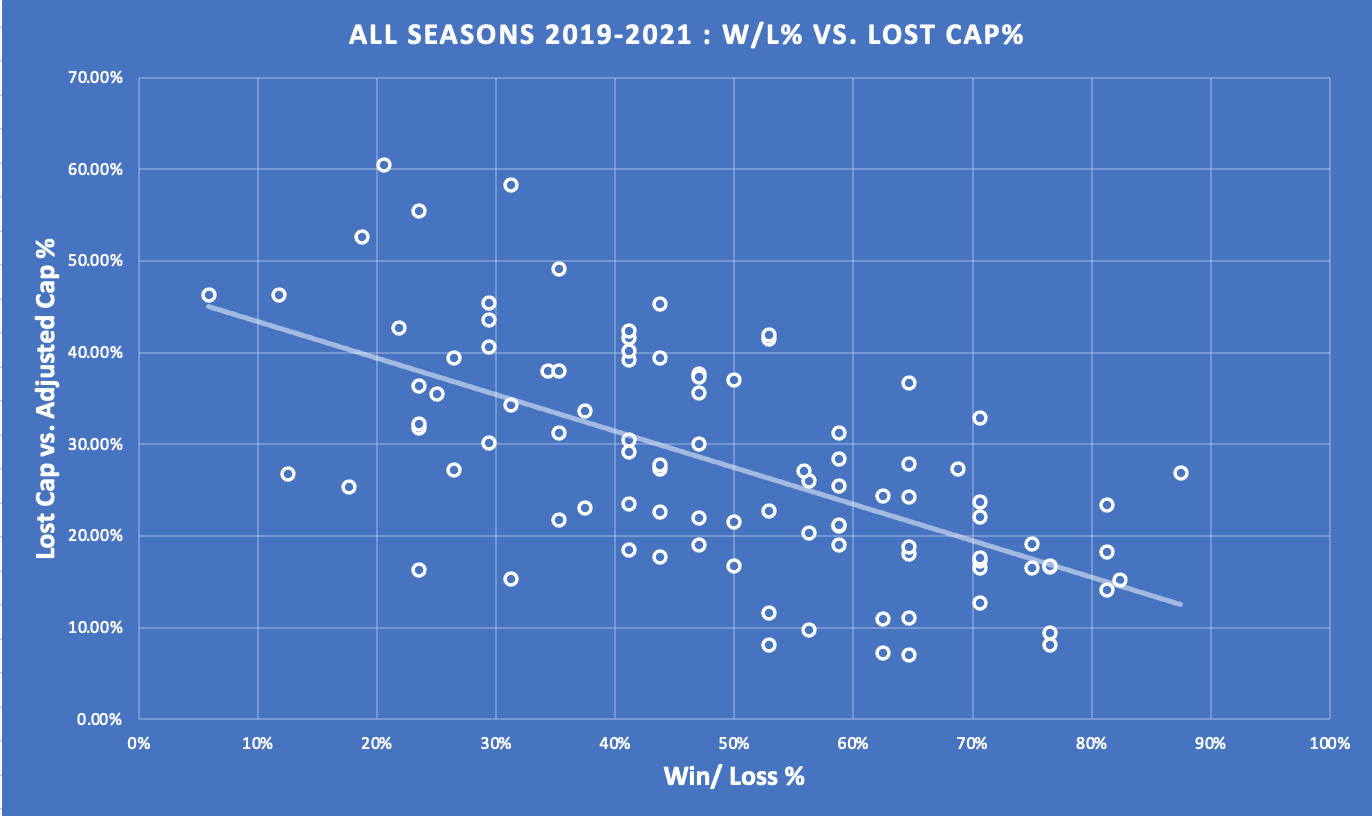
This three-year result is a little cleaner than the year-by-year review as this removes any obvious manipulation of the cap to favor one year over the next. It continues to show a clear correlation between the teams that limit the salary cap impacts of dead cap penalties/injuries/NFI and the team’s long-term W/L record.
For reference, the teams with the five lowest Lost Cap hits vs. Adjusted Cap over the three-year period were the Buffalo Bills (9.98%), Green Bay Packers (13.51%), Tampa Bay Bucs (13.70%), Kansas City Chiefs (14.82%), and Indianapolis Colts (16.85%). Between this group there tallied up 7 Championship Game appearances and 2 Super Bowl titles.
The worst five were the New York Jets (49.09%), Detroit Lions (44.06%), Denver Broncos (41.15%), Washington Commanders (41.10%), and Carolina Panthers (40.07%). Between this group they have recorded 0 Playoff appearances.
A Focus on Dead Cap
To properly examine the detail behind the relationship of W/L success and Lost Cap, we’ll split this out and focus now on Dead Cap and its relationship with success. Dead Cap is the only part of Lost Cap that is purely intentional by the team, as they’ve taken the decision to cut/trade a player and accept the dead cap hit against their resources. It’s clear that not all Dead Cap is inherently bad. Some teams need to cut bait with a player for the greater good, whether that’s because the player simply isn’t performing, a trade package is too enticing, or a more exciting alternative has come available (Think the Rams trading Jared Goff away to get Matt Stafford). That said, whether the decision to accept the hit was good or bad, Dead Cap is a drain against available cap and will have an impact on a team’s ability to put a competitive team together.
In Fig.4 we’ve mapped Dead Cap over our 3-year period against W/L% and you can see the general trend again favoring teams with lower Dead Cap hits.
Fig. 4
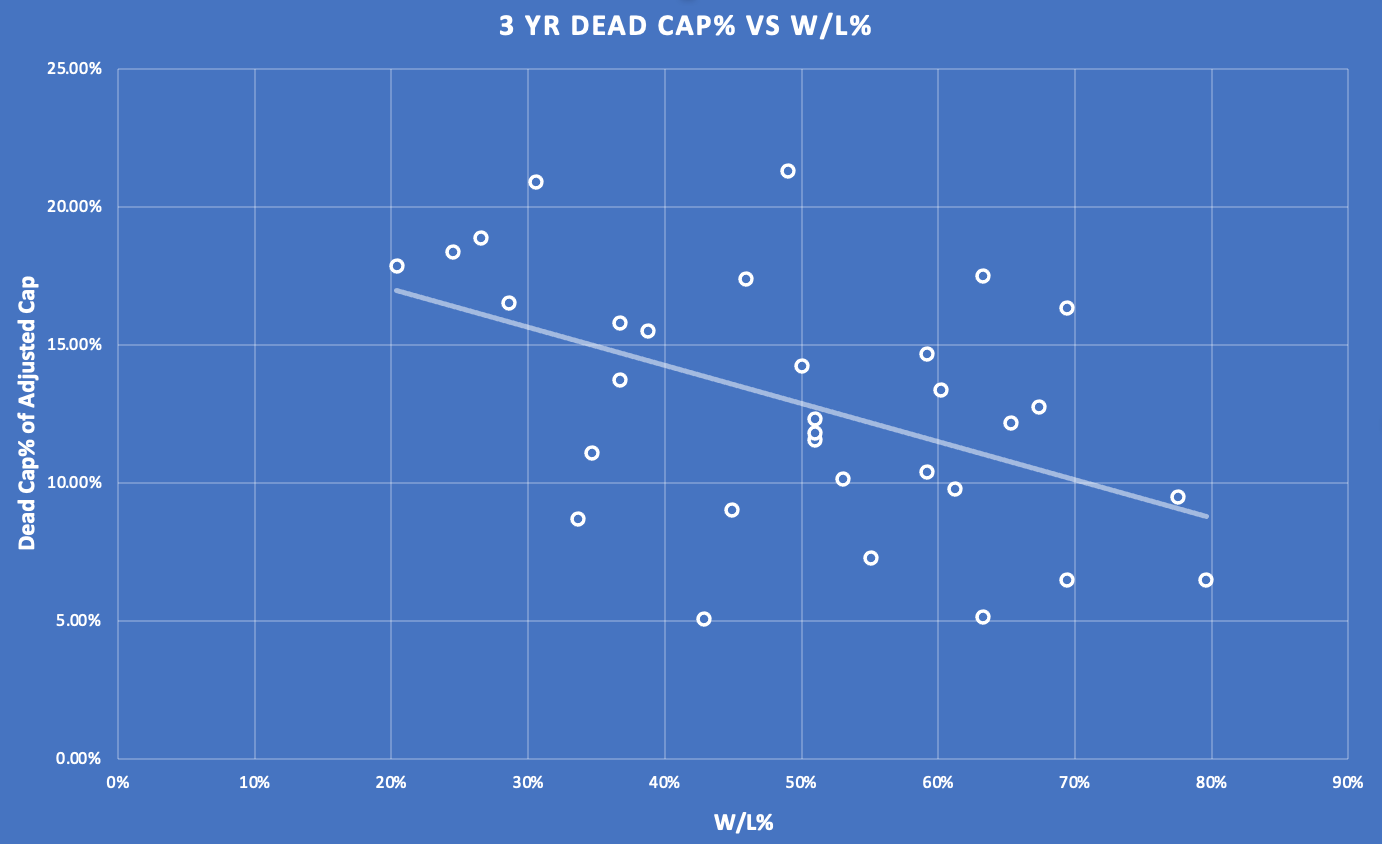
The relationship isn’t quite as clear as with total Lost Cap (which also included injuries/suspensions etc…). The result also doesn’t account for potential downstream benefits of Dead Cap for the future of the team beyond the time horizon, for example, the Texans $16.2m cap hit in 2022 for Deshaun Watson. However, in general it’s clear that minimizing dead cap has a visible relationship with on-field performance.
The teams with the 5 lowest Dead Cap hits vs. Adjusted Cap in the three-year period were the LA Chargers (5.06%), Tampa Bay Bucs (5.15%), Green Bay Packers (6.46%), Buffalo Bills (6.48%), and Indianapolis Colts (7.27%).
The worst five were the Miami Dolphins (21.30%), Carolina Panthers (20.87%), New York Jets (18.88%), Detroit Lions (18.36%), and Jacksonville Jaguars (17.83%).
A Focus on Injuries and Absences
Finally, we’ll deep dive into the other aspects of Lost Cap which are the injuries and absences. Below in Fig.5 we plot each season’s cap hits associated with injured/ absent players vs. the W/L record for the season.
Fig.5
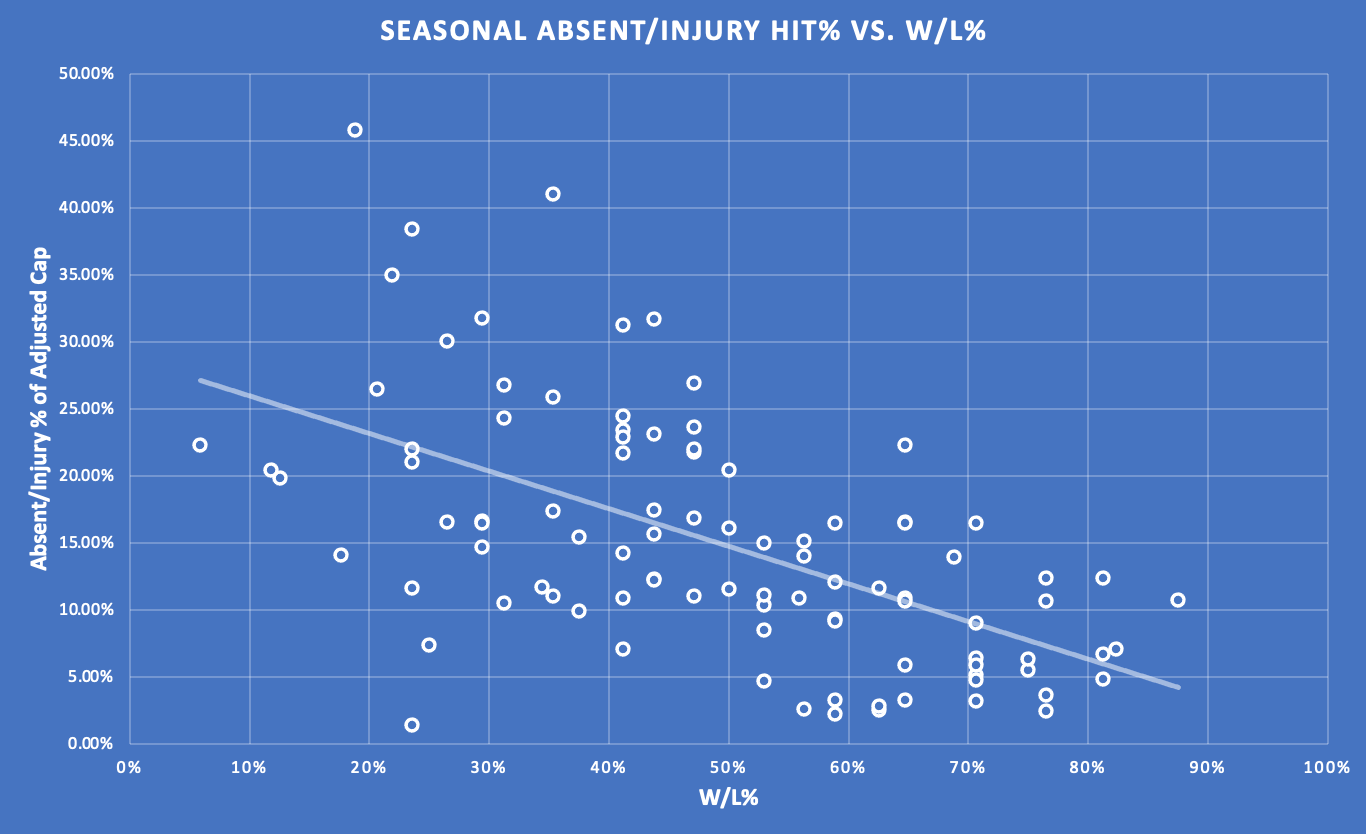
Again, unsurprisingly we see a positive trend as a team can only be as successful as their healthy players make them. Even when players are injured or absent the cap space allocated to them still counts against the adjusted salary cap, draining overall team productivity. Injuries/absences in general can’t be helped, but it’s still an area a team could potentially gain a competitive advantage. In a parity-based league perhaps an even greater emphasis on player engagement and injury prevention is a way to create more on-field success.
Key Takeaways
- Maximizing Active and Usable Cap Space is a pathway to on-field success – as we’ve seen in this study, the teams that minimize Lost Cap, increase their opportunity for wins and playoff success
- Cap Rollover can push teams over the top – the teams that participated in Championship games on average had $2.5m/2% more in their Adjusted Cap than non-playoff teams
- Dead Cap has consequences – yes, teams can clear space with a release/trade but is the penalty worth it? While in a single season, Dead Cap can be massaged around other moves, it still needs to be minimized over the long term to ensure sustainable success
- Injury & Absence/Suspension Prevention perhaps needs to be even more emphasized – only 1 team has had over 20% hit in Injury/ Absences against their salary cap, and still had a 60% W/L% and postseason appearance (2020 Tennessee Titans)