Breakdowns
4/3/22
9 min read
The Hidden Reality of Draft Value: Part 1 — Round by Round

The Los Angeles Rams were this year's Super Bowl winners and have largely been in contention for a championship since Sean McVay took the helm in 2017. The organization has operated in a seemingly impatient manner when it comes to the draft, largely disregarding the ‘what if’ of a young draft pick in the early rounds of the draft for a proven commodity in the league. Their rogue view on the draft has already allowed them one championship, but are we likely to see this methodology implemented throughout the league? Is there something they know about the draft that nobody else is aware of?
What data was used?
A comprehensive database was built using Pro Football Focus’ draft data with Over the Cap’s contract data to understand the difference between draft picks' first contracts and their second contracts if they receive one. The draft data is from 2010-2017. Recent years were excluded to not generate inaccurate insights due to the picks still being on their rookie contracts.
The general consensus is that each draft pick closer to the top has significantly greater value than the next. Our hypothesis is that the draft does not actually work perfectly linearly and that there is value to be found with every pick.
How do we define success?
Determining a successful draft pick is both objective and subjective. Viewing it from a purely nominal value, a metric was calculated to determine a successful pick. This metric is known as the SC Pay Ratio, which refers to the second contract pay ratio. It takes the amount of money guaranteed in the second contract and compares it to the guaranteed money from the first contract.
In general, a player receiving more guaranteed money in their second contract has performed better than their pick position suggests. The data is broken down into whether the second contract comes from the same team or an alternative team.
Initial view of the Data
A quick look at what happens to picks who receive second contracts show an interesting story in the graph below:
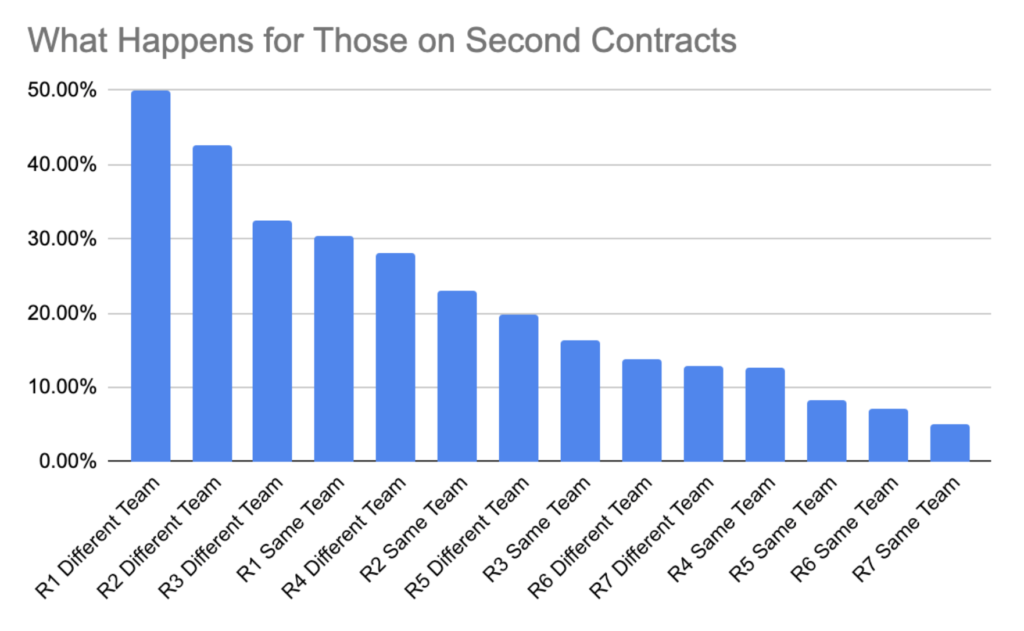
- The three largest groups that share the greatest proportion of the same result lie in the picks from round one to round three whose second contracts come with different teams. This is 50% of round one picks, 43% of round two picks, and 32% of round three picks
- The 4th greatest proportion (31%) is those round one picks whose second contract came from the same team
- The order of these proportions speaks to teams’ willingness to take a chance on draft pedigree even for the second contract. Round one through round three picks will often get a second chance in the league somewhere else. Based on the 2010-2017 data, the most likely outcome for a player drafted in rounds one and two is a second contract with a different team. For round three, the most likely outcome is no second contract (51%), but a second contract is almost a coin toss at this point.
What about the price of these contracts?
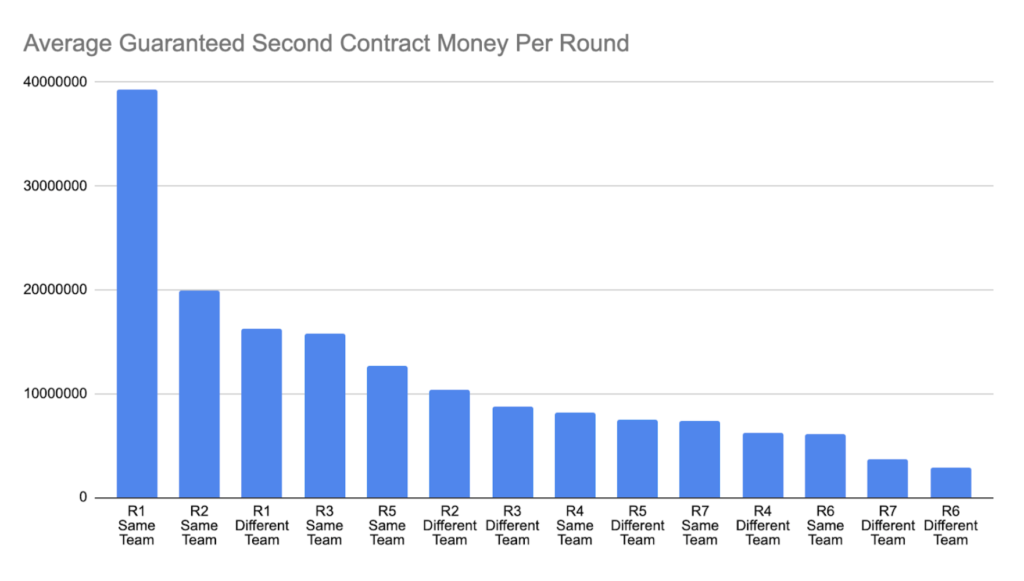
- It’s evident from the above graph that the league's largest second contracts go to those who were drafted in the first round and get signed to an extension by the same team. As previously mentioned, this is 31% of round one picks, which indicates that about one in three picks from the first round will be signed to a second contract with the same team. This is the first indicator of a successful first round pick and might be quite alarming that only one in three appear to work out.
- The guaranteed money for those round one picks getting their second contracts with the same team is just under forty million, which almost doubles the next highest grouping which is just under twenty million (the round two picks that sign with the same team).
- Round three players signing with the same team tend to be valued at the same price as round one players signing with a different team (15.7 million vs. 16.2 million, respectively)
- What is particularly interesting to note is that fifth round picks who re-sign with the same team outperformed round four picks who re-signed with the same team in terms of guaranteed money in their second contracts. This also occurred with rounds seven and six. What this suggests is that there is a drop off after round three where there is not much of a difference between a fourth round pick and seventh round pick.
What rounds actually tend to outperform their draft position?
A rookie outperforming their contracts is one of the cheat codes to winning in the NFL. The SC Pay Ratio provides a good indicator as to which rookies outperformed their initial rookie contract based on the guaranteed money they received with their second contract.
Looking at the SC Pay Ratio per round provides some interesting results:
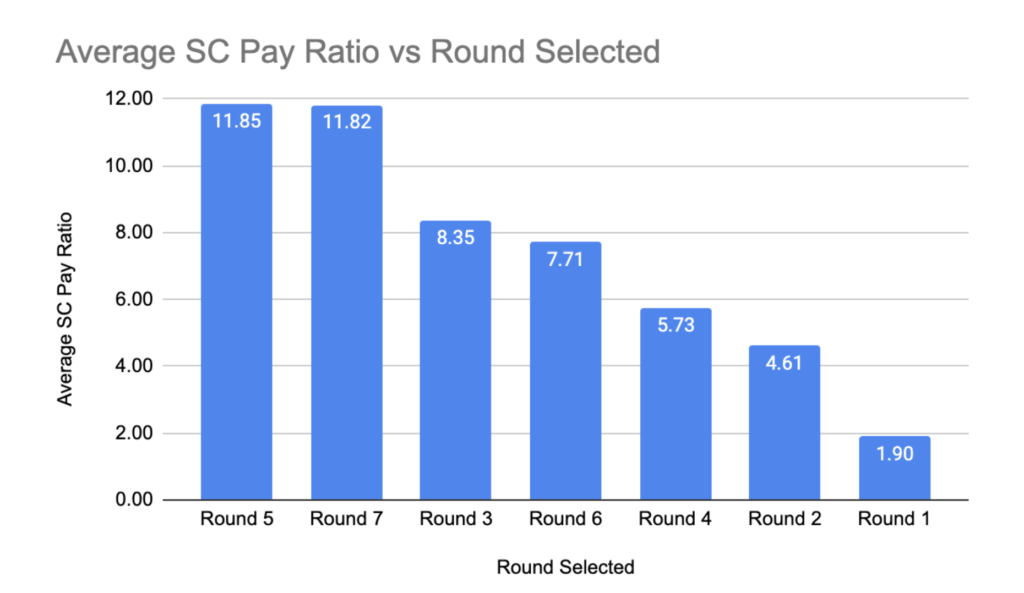
- Rounds one and two tend to offer the least value since the initial rookie contracts guarantee quite a lot of money for people that have never taken a snap in the NFL. This actually suggests that there is a market inefficiency which benefits those players over the teams. Only 30% of the round one picks will get a second contract with the same team (in essence, the best case scenario for the team correlating with a good pick)
- The average SC Pay Ratio for a player picked in round one is 1.90. This is a score performing only slightly above the expected for the round they were picked in. It states that although the best players (or most expensive) may come from round one, it is hard to extract their value from how much they are paid before they’ve even proven themselves. If the rookie contracts for round one and round two were that cheap, we would see their Second Contract Pay Ratio be much greater than the original contract.
- Rounds three, five and seven perform similarly in the SC Pay Ratio, which leads us to believe that there is extreme value to be found in these rounds.
Remember, value is compared to the round that player was drafted in and not other rounds. Therefore, a high SC Pay Ratio for a player in round seven represents an excellent value pick for round seven. It is not stating that the player is any more or less useful than a player in another round, only that the position of the pick represents better value.
Having mentioned above that many players in each round fail to get second contracts, let’s build that a bit more into our SC Pay Ratio metric and create the Expected SC Pay Ratio metric. This multiplies the proportion of the round in that category by the SC Pay Ratio of the category.
For example, 31% of round one get second contracts with the same team. These contracts have 3.23 times the amount of guaranteed money than the first contract.
Expected SC Pay Ratio = 31% * 3.23 = 0.98
When this is done for all categories we get the following:
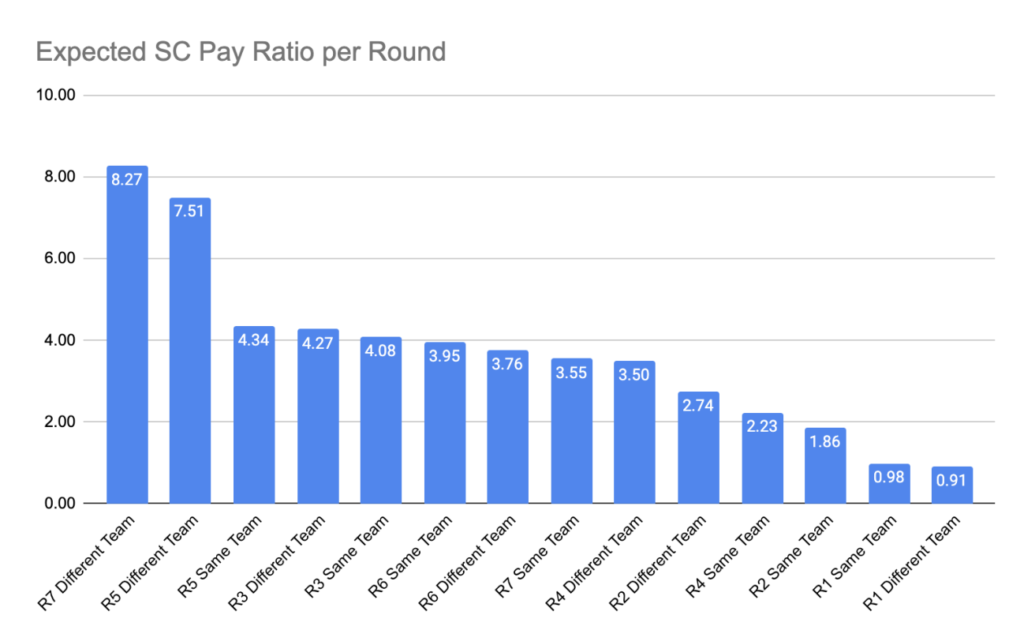
Some key results from above are as follows:
- R1 Same Team and R1 Different Team both fall beneath one, which shows that we should expect round one picks in general to not exceed the position in which they were picked. On average, we should expect them to not get a second contract and should adjust our expectations. This tends to point towards the result of round one picks not meeting the hype they are given, prior to the draft.
- The two highest performing categories are R7 Different Team and R5 Different Team. This represents the players who have totally exceeded their draft position and are looking to cash in, which usually happens through teams that did not draft them who end up providing pretty healthy second contracts for the players.
- Rounds three, five and six appear to show the biggest market inefficiencies for teams to exploit. They all have relatively high expected SC Pay Ratios which shows one of either two things:
-
- The rookie contracts for these rounds offer extremely low guaranteed money
- There is not much difference in the quality of player in these rounds, so teams should look to gather more picks in these rounds to get better value long term
Coaching and Front Office regimes tend to live and die by the early round picks they make, but perhaps the quality of the decision makers should be determined by the value they accumulate later on in the draft.
Sean McVay, the current Head Coach of the Super Bowl champions, has famously never had a first round pick since he started his tenure. Some of the early round selections they have traded have led to players such as Jalen Ramsey, Von Miller and Matthew Stafford. One thing these players all have in common is that they all are first rounders that exceeded their Expected SC Pay Ratio
In trading two first round picks for Ramsey, McVay & Les Snead could roughly calculate an Expected SC Pay Ratio of 1.96 (2*0.98) compared to what Ramsey provided at 3.05. The Rams are removing risk here when they aggressively trade for known commodities. The Rams then collect mid-round picks and have had no fewer than eight picks in a draft since McVay took over.
This may be insight into something the league has overlooked, and they are playing the percentages. Otherwise, reviewing the draft history through the lens of guaranteed money at second contract compared to first shows there is significant value in the middle to late rounds, and the margin for error is much smaller in the early rounds.
It is very rare that value is secured with early picks due to the large sums of guaranteed money these picks receive before proving they can play at the NFL level.
So what next?
The benefit to digesting this data and interpreting it is to understand value better when approaching the draft to set up your organization for success. Round by round is only one lens with which to view this data.
In the upcoming articles, these are the following questions that will be addressed:
- Which positions offer the best return on draft value in the early rounds?
- Are any specific teams better than others at making good value picks?
- Is there much difference in picking at the start of round one compared to the end?
- How to determine whether trading up/back or sticking is the best option according to the Expected SC Pay Ratio?
- Which players have been the best value picks according to the SC Pay Ratio?