Analysis
5/12/21
2 min read
Study: Cap Allocation for Recent Super Bowl Teams vs. Rest of the NFL
One of the greatest superpowers in an NFL front office is the ability to value position groups and players correctly, which directly correlates to knowledge, understanding and properly allocating cap space. When it comes to learning, the past can foretell the future with hints along the way. The teams that have found success over the greater half of the past decade have taken clues from the past, and updated them to gain an advantage. One of the most lucrative ways to gain an advantage is by properly distributing cap space. Taking a look at the teams that made the Super Bowl, front offices can gain a perspective on spending trends that most correlate with winning.
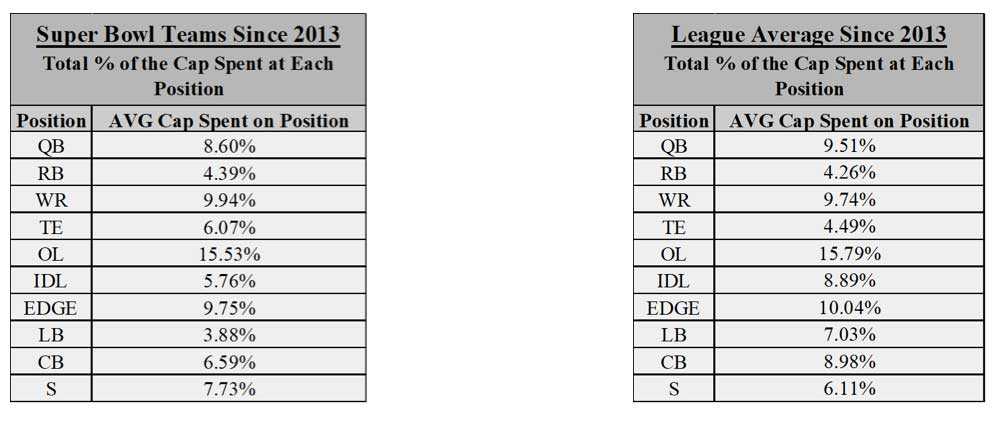
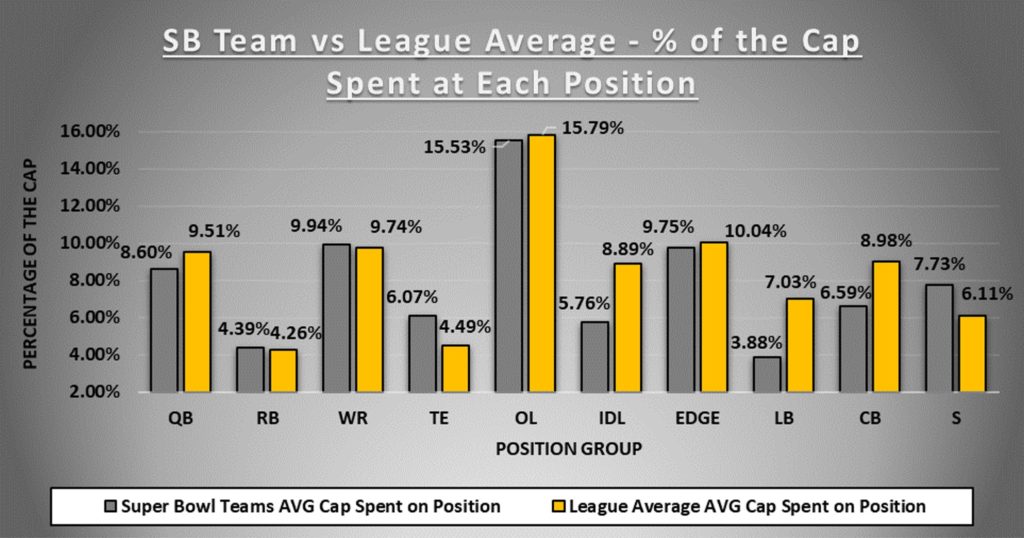
The tables below show the positional breakdown of cap spending of Super Bowl participants and league average teams from 2013-2019, while the graph compares the two:
Takeaways:
- Super Bowl teams have put more emphasis on the safety position than the cornerback position while the league has taken the opposite approach
- Positions of value for Super Bowl teams: OL, WR, EDGE, QB, S
- Positions of value for rest of the NFL: OL, EDGE, WR, QB, CB
- Biggest discrepancies in % of cap allocated (Super Bowl vs. League average):
- LB → SB teams have followed the trend of less value on LBs (3.88%) while the league is a bit behind (7.03%)
- CBs → League is paying more for their CBs to fill out the secondary while the SB teams are stocking up on S
- IDL has garnered more attention from the league on average than SB teams while they are looking to spend $ at the TE position over league average
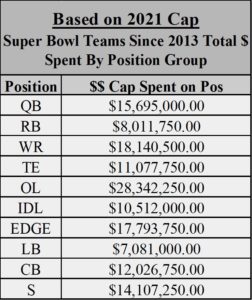 Next, the total dollar amount spent at each of these position groups was determined using the same data range. Comparing the percentages spent by position group from the Super Bowl team to the 2021 cap number of $182 million. Here is the breakdown of the average spending since 2013 of Super Bowl teams by position group:
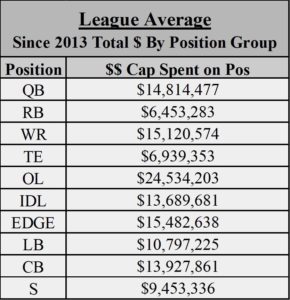 Last, based on the cap that season (2019: $188.2 million, 2018: $172 million, 2017: $167 million, 2016: $155.27 million, 2015: $143.28 million, 2014: $133 million, 2013: $123 million), the league average spent on each position group was calculated:
Jared Hammond contributed to this story