Analysis
5/11/22
6 min read
How Super Bowl Champions Defy NFL Trends
The NFL is an ever-evolving brand as year upon year, more changes are made to improve the quality of the product. The same can be said for the performances on the field and how coaches evolve their schemes to try and get ahead of the curve and gain an advantage. So, how has the use of different coverages and routes changed in the past couple of years, and how do the Super Bowl champions compare against the averages?
2019:
| Coverages | Cover 0 | Cover 1 | Cover 2 | Cover 3 | Quarters | Cover 6 | 2 Man | Red Zone (brackets etc) | 3 Match | Others |
| 2019 Averages | 3.1% | 30.3% | 9.9% | 27.6% | 9.9% | 5.9% | 1.5% | 3.7% | 4.0% | 4.1% |
| Kansas City Chiefs | 7.4% | 20.0% | 13.7% | 22.5% | 10.4% | 8.3% | 4.4% | 4.8% | 2.0% | 6.5% |
| Routes | Go | Post | Corner | Out | In | Comeback | Hitch | Slant | Flat | WR Screen | Cross/Drag |
| 2019
Averages |
14.8% | 6.2% | 3.6% | 16.8% | 7.2% | 1.1% | 15% | 8% | 6.3% | 6.1% | 15% |
| Kansas City Chiefs | 12.7% | 6.1% | 5.4% | 17.2% | 5.4% | 0.6% | 17.8% | 7.4% | 5.1% | 6.2% | 16.2% |
In the 2019 season, Kansas City Chiefs played a very low percentage of snaps with only 1 high safety compared to the league average (44.5% against the league average 61.9%) due to the defensive scheme Steve Spagnuolo likes to employ. Tyrann Mathieu and Juan Thornhill were the obvious options to play as the 2-high safeties with their range but versatile CBs like Charvarius Ward meant they were able to play plenty of Cover 6 and roll a CB to play the deep 1/4 zone in many instances. The speed of the defensive backs, and ability to stay tight in man coverage also meant that the Chiefs could play a lot more Cover 2 Man (or Cover 5) than the league average and shutdown opposition offenses. For a first season in the job in Kansas City, Spagnuolo did an excellent job at maximizing the personnel he worked with.
On offense, Patrick Mahomes will always be the main talking point of the Chiefs’ offense. However, despite their renowned deep-threat offense from that season, they targeted WRs deep outside the numbers more than the NFL average (on corner and out routes). Tyreek Hill picked up so many yards after the catch from Hitch routes, getting the ball in his hands quickly and letting him turn up field. Other interesting numbers were the low usage of flat and in routes, targeting the short game outside the numbers and over the middle of the field less than other teams.
2020:
| Coverages | Cover 0 | Cover 1 | Cover 2 | Cover 3 | Quarters | Cover 6 | 2 Man | Red Zone (brackets etc) | 3 Match | Others |
| 2020 Averages | 4.2% | 25.1% | 10.4% | 28.0% | 11.8% | 7.0% | 1.6% | 4.0% | 3.7% | 4.2% |
| Tampa Bay Buccaneers | 3.3% | 17.6% | 14.5% | 27.4% | 15.7% | 8.1% | 4.8% | 3.0% | 0.8% | 4.8% |
| Routes | Go | Post | Corner | Out | In | Comeback | Hitch | Slant | Flat | WR Screen | Cross/Drag |
| 2020
Averages |
14.8% | 3.8% | 3.8% | 16.1% | 6.7% | 0.9% | 15.1% | 9.2% | 6.7% | 7.2% | 15.6% |
| Tampa Bay Buccaneers | 21.9% | 2.7% | 3.9% | 15.7% | 6.1% | 0.2% | 13.8% | 7.8% | 5.6% | 10% | 12.2% |
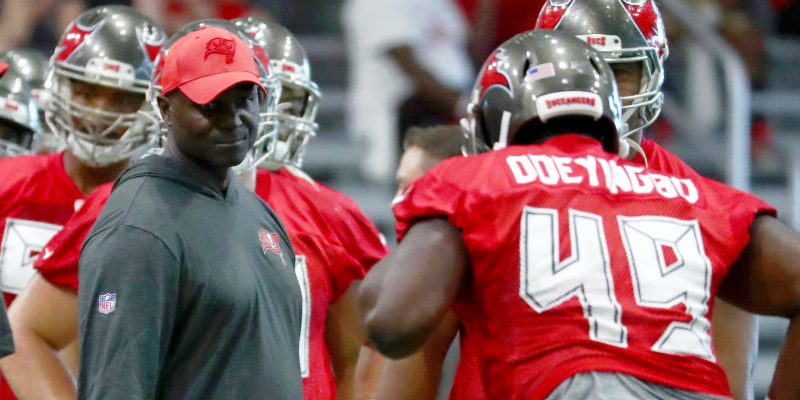
The 2020 Tampa Bay Buccaneers made a concerted effort to maintain a 2-high Safety look more than the league average, similarly to the Chiefs from the year before. On 43.1% of defensive snaps, they presented these shells (in Cover 2, Quarters, Cover 6 and Cover 2 Man) compared to the league average of 30.8%. Their use of Man coverage was the most intriguing, as they used Cover 2 Man a lot more than league average, however, Cover 0 and Cover 1 significantly less. This was due to their CBs, Carlton Davis and Sean Murphy-Bunting, performing well in man coverage, but by maintaining the two Safeties overtop of the man coverage, they still afforded themselves extra protection and didn’t allow too many deep completions.
On offense, the Bucs and Tom Brady executed a versatile scheme crafted by Byron Leftwich. They threw the ball well above average on ‘Go’ routes to stretch the field out, but at the same time were above league average for WR screens, throwing the ball around the Line of Scrimmage and short areas of the field. Despite speculation about Tom Brady’s arm strength in his 22nd season in the NFL, he successfully led this vertical offense - which Bruce Arians had previously employed in Arizona, to immense success. While the defense was the main talking point for the 2020 Super-Bowl-Winning Tampa Bay Buccaneers, the offense was more than proficient.
2021:
| Coverages | Cover 0 | Cover 1 | Cover 2 | Cover 3 | Quarters | Cover 6 | 2 Man | Red Zone (brackets etc) | 3 Match | Others |
| 2020 Averages | 4.2% | 25.1% | 10.4% | 28.0% | 11.8% | 7.0% | 1.6% | 4.0% | 3.7% | 4.2% |
| Tampa Bay Buccaneers | 3.3% | 17.6% | 14.5% | 27.4% | 15.7% | 8.1% | 4.8% | 3.0% | 0.8% | 4.8% |
| Coverages | Cover 0 | Cover 1 | Cover 2 | Cover 3 | Quarters | Cover 6 | 2 Man | Redzone (brackets etc) | 3 Match | Others |
| 2021 Averages | 4.0% | 23.4% | 11.2% | 30.4% | 11.4% | 7.7% | 1.4% | 4.0% | 3.5% | 3.0% |
| Los Angeles Rams | 2.7% | 12.0% | 1.5% | 38.8% | 16.3% | 15.4% | 0.3% | 4.9% | 5.7% | 2.4% |
| Routes | Go | Post | Corner | Out | In | Comeback | Hitch | Slant | Flat | WR Screen | Cross/Drag |
| 2021
Averages |
14.4% | 3.6% | 3.7% | 15.7% | 6.8% | 1.0% | 15.8% | 9% | 7% | 8.3% | 14.6% |
| Los Angeles Rams | 12.3% | 4.7% | 5% | 15.1% | 9.5% | 0.9% | 13.2% | 7.4% | 6.3% | 11.7% | 13.8% |
The 2021 and most recent Super Bowl Champions the LA Rams went away from the latest trends on the defensive side of the ball. Whereas the league has been trending towards using more 2-high Safety shells, Raheem Morris — who learned his craft under Former 33rd Team Member, Dan Quinn, employed a 1-high safety look significantly more than the rest of the league. The scheme which Quinn employed in Seattle with the “Legion of Boom” has gone out of fashion in recent years with great offensive minds finding more ways than ever to stretch the single high safety. However, with great personnel, Morris was able to have success in his Cover 3 and Cover 3 Match shells (using it on 44.5% of snaps compared to the league average of 33.9%) and the addition is you get another safety down in the box to defend the run, but he had such talent on the backend, that they were strong against the pass too. Therefore, an extra player to stop the run and still limiting the passing game of opponents meant it was an easy decision to base out of Cover 3.
On the offensive side of the ball, Sean McVay took full advantage of Matt Stafford’s precision throwing in 2021, throwing a lot more “In” routes compared to the rest of the league. The most notable being in the Super Bowl when Stafford threaded the needle on a tight throw in zone coverage to pick up another first down and keep a crucial drive alive. They also used WR screens to their advantage, with tricky WRs like Van Jefferson, Robert Woods and Odell Beckham Jr all gaining useful yardage. The Post Route was also particularly successful for the Rams with so much pace on the roster, and often attention on Cooper Kupp so Jefferson had many receptions on deep post routes, and obviously Kupp won his matchups all over the field.
| Coverages | Cover 0 | Cover 1 | Cover 2 | Cover 3 | Quarters | Cover 6 | 2 Man | Red Zone (brackets etc) | 3 Match | Others |
| 2021 Averages | 4.0% | 23.4% | 11.2% | 30.4% | 11.4% | 7.7% | 1.4% | 4.0% | 3.5% | 3.0% |
| 2020 Averages | 4.2% | 25.1% | 10.4% | 28.0% | 11.8% | 7.0% | 1.6% | 4.0% | 3.7% | 4.2% |
| 2019 Averages | 3.1% | 30.3% | 9.9% | 27.6% | 9.9% | 5.9% | 1.5% | 3.7% | 4.0% | 4.1% |
Comparing the league averages over the last 3 years on defense, it is extremely interesting to see the dramatic shift away from Cover 1 defenses, yet still the rise in Cover 3 (maintain the single high safety shell). Potentially the most notable change has been the increase in Cover 2 and Quarters looks, meaning defenses have more protection deeper down the field to stop big chunk plays against explosive offenses.
| Routes | Go | Post | Corner | Out | In | Comeback | Hitch | Slant | Flat | WR Screen | Cross/Drag |
| 2021
Averages |
14.4% | 3.6% | 3.7% | 15.7% | 6.8% | 1.0% | 15.8% | 9% | 7% | 8.3% | 14.6% |
| 2020
Averages |
14.8% | 3.8% | 3.8% | 16.1% | 6.7% | 0.9% | 15.1% | 9.2% | 6.7% | 7.2% | 15.6% |
| 2019
Averages |
14.8% | 6.2% | 3.6% | 16.8% | 7.2% | 1.1% | 15% | 8% | 6.3% | 6.1% | 15% |
On the offensive side of the ball, there haven’t been as many shifts schematically in the last 3 years, but there has been a notable increase in WR screens, as Offensive Coordinators try to create creative ways to get the ball in the hands of their best players. From 2019-2021 though, the number of routes targeting shorter gains (such as hitches, flat routes) have increased while the usage of typically deeper developing routes like the Post has significantly decreased.