NFL Analysis
10/18/21
7 min read
Introducing a New QB Stat: Comprehensive Passing Metric
What really makes for a successful quarterback? The ultimate goal of the sport is to win games, so how do we compare a pass-heavy campaign with a low win total, such as 2007 Pro Bowl Drew Brees and the 7-win Saints, to a winning season that may have required less competence from the passer, such as Joe Flacco’s 2008 rookie season when Baltimore made the AFC Championship game? Statistics around the league and media like passer rating and ESPN’s Total QBR have attempted to isolate the quarterback and evaluate their play, but none have put a heavy emphasis on rewarding the factors that help win games.
It is with this in mind that we introduce the Comprehensive Passing Metric (CPM). CPM is designed to evaluate the question of How well did the quarterback put you in a position to win? With over 120 variables evaluated and expert insight from The 33rd Team's roster of former NFL head coaches, general managers, and scouts to make sure they matter, we’ve come up with a statistic that truly evaluate how well your passer put you in a position to win. Split into individual game and season-long models, CPM is significantly predictive of wins on both an individual game and a season level. On a scale of 1-10, with 10 being the best, CPM is a tool to objectively compare NFL quarterbacks where it matters.
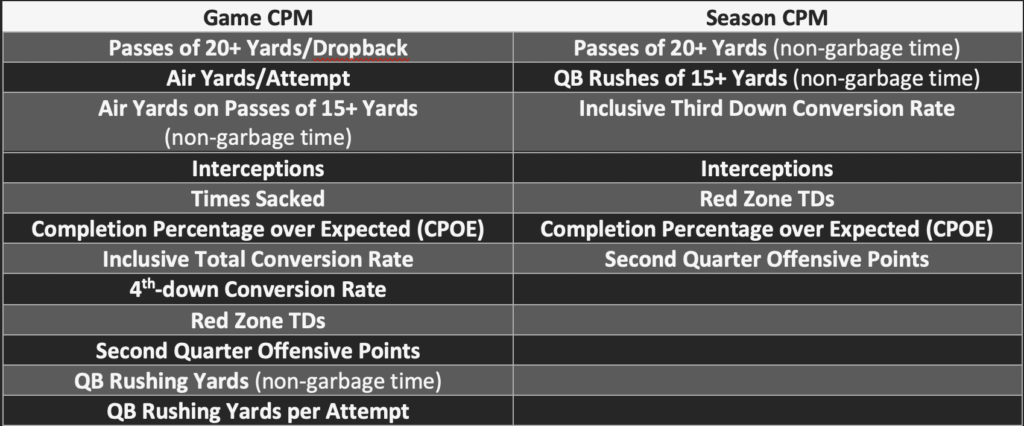
What goes into CPM? Broadly falling under the four categories of creating explosive plays, managing defensive pressure, accuracy over expected, and production at key times. See below for the specific variables included:
Note: Garbage time refers to when either team, while in the fourth quarter, has less than a 5% chance to win per nflfastR’s model.
Before we get into the results, let's dive into a quick FAQ to explain some of the methodology and specific variables. Feel free to skip around or pass over the section entirely to get to the rankings.
Why did you make two different models?
Season CPM is more predictive of the total number of wins a team will get in a season than any average of game CPM.
What is Inclusive Total Conversion Rate and Inclusive Third Down Conversion Rate?
Going off the advice of one of our NFL Insiders, we wanted to test conversion rate when we counted touchdowns on first and second down as third down conversions. Indeed, these did improve the model. Specifically, Inclusive Total Conversion Rate is the percentage that a team converts their third and fourth down attempts when adding successful touchdowns on 1st and 2nd down to both the “conversions” and “attempts” columns.
Doesn’t that overlap with 4th-down Conversion Rate? And what about teams that don’t have a fourth down attempt?
Absolutely! However, the game model considers both factors important, even when considered together. When a team doesn’t attempt a fourth down, it’s unfair to give them a 0% as if they had failed an attempt, so we instead assign them a rate of 49.74% — the league average conversion rate between 2006-2020 (the period this model was trained on).
What’s with the emphasis on the second quarter?
Although coaches and the media emphasize the fourth quarter, it’s actually the second quarter that has the largest impact on whether a team wins or not. In 2020, the team that scored more points in the second quarter won 73.53% of their games, while the “winner” of every other individual quarter was below 66%. In fact, the team that scored more points in the second half won only 66.93% of their games.
How well did you actually manage to predict wins?
Let’s look at how well teams did when we group their QB’s CPM:
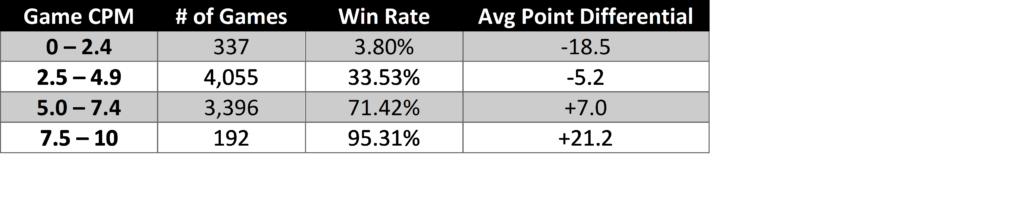
This shows a pretty clear relationship between wins and CPM, with the best group (7.5 – 10 CPM) winning an astounding 95.31% of their games by an average of three touchdowns. In fact, of the top 100 game CPM’s since 2006, only three came in losing efforts. Those three? Jameis Winston’s 2018 return from the bench, replacing Ryan Fitzpatrick in the third quarter of a Week 11 bout and turning a 24-7 deficit into a shootout, narrowly losing 38-35. A stellar effort by a second-year Dak Prescott that narrowly lost to an Aaron Rodgers-to-Davante Adams game-winning TD with 11 seconds remaining, finishing 35-31. Finally, a mainstay of the “Let Russ Cook” movement, an early-season 2019 matchup between the Saints and Seahawks where Russell Wilson put up 406 passing yards on 50 attempts while adding two rushing touchdowns in the fourth quarter, but it ultimately wasn’t enough to overcome the 13-point advantage that Alvin Kamara and Co. built in the second quarter.
What about season CPM (including playoffs)?
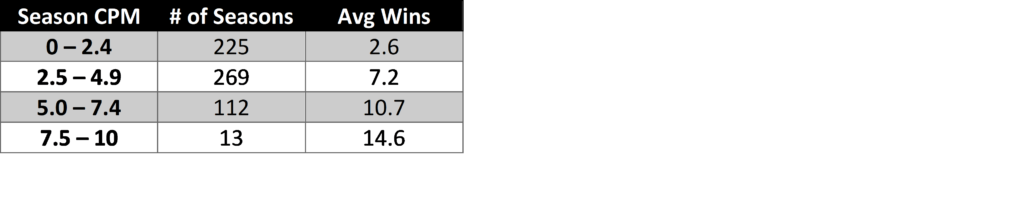
Again, we see the relationship between wins and CPM, but it’s also obvious how much more difficult it is to put a high CPM over an entire season — only 125 passers managed a season with over 5.0 CPM. This speaks to how great quarterbacks are truly far more important to wins than even average passers.
From a numbers perspective, game CPM had an R-squared of 0.2401, indicating that QB play (as measured in these factors) accounts for 24.01% of a win (only counting passers who had 15-plus dropbacks or QB runs in a game). Season CPM had an r-squared of 0.6701 when predicting wins (including playoffs) that the passer had 10-plus dropbacks (or QB runs) in. This number is a lot higher than the game model, but that makes sense because there are many more opportunities for a great passer to make his mark — great passing performances won’t win every game, but they are very likely to win a lot of games over a season.
Enough already! Where are the rankings?
Of course! Here’s the top 20 game CPM rankings since 2006, with some factors not displayed for brevity.
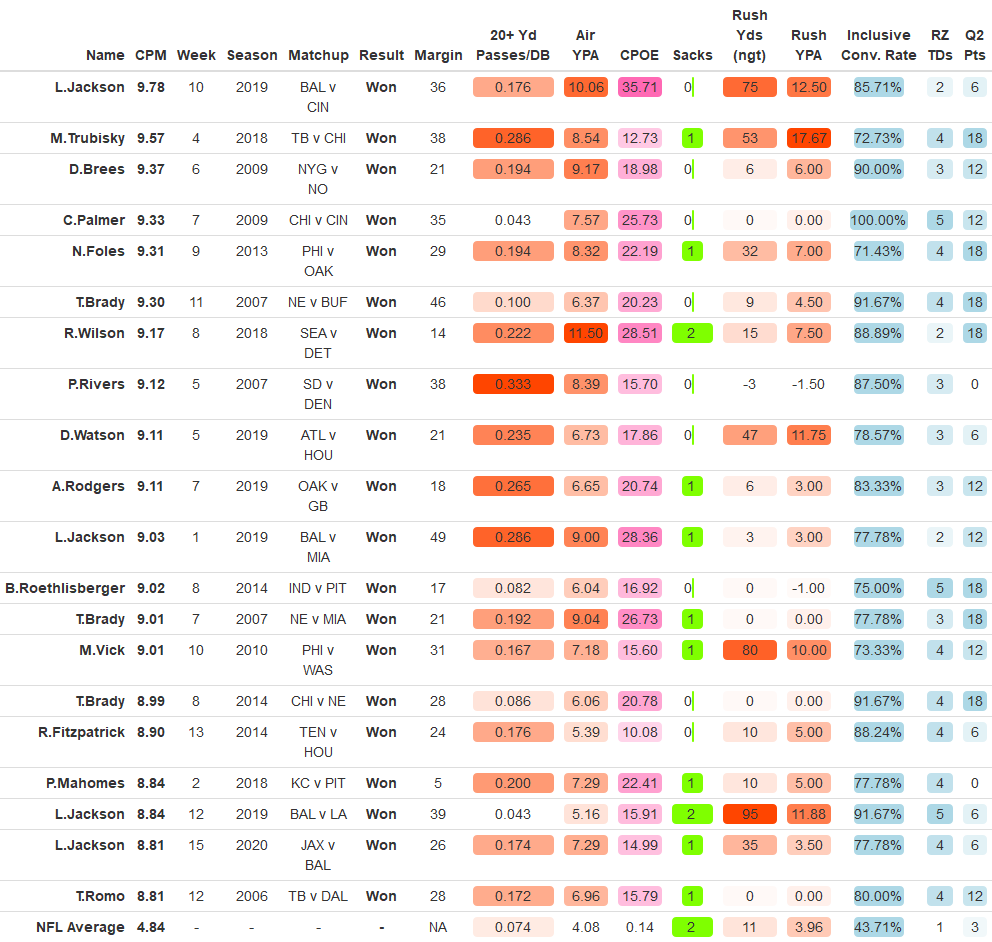
The key takeaway from this chart, outside of how dominant peak Tom Brady and Lamar Jackson are, is how much we see some less-expected names pop up. This doesn’t make game CPM bad! The most glaring inclusions, Mitch Trubisky at 2 and Nick Foles at 5, both who had fantastic respective games. Against Tampa Bay in 2018 Trubisky threw 6 TDs against only 7 incompletions, while Foles actually bettered both marks against the Raiders with 7 TDs and 6 incompletions. Rather, the conclusion is that a single dominant game doesn’t automatically guarantee a player a gold bust in Canton — and it shouldn’t. The season CPM rankings below will be much better for that discussion:
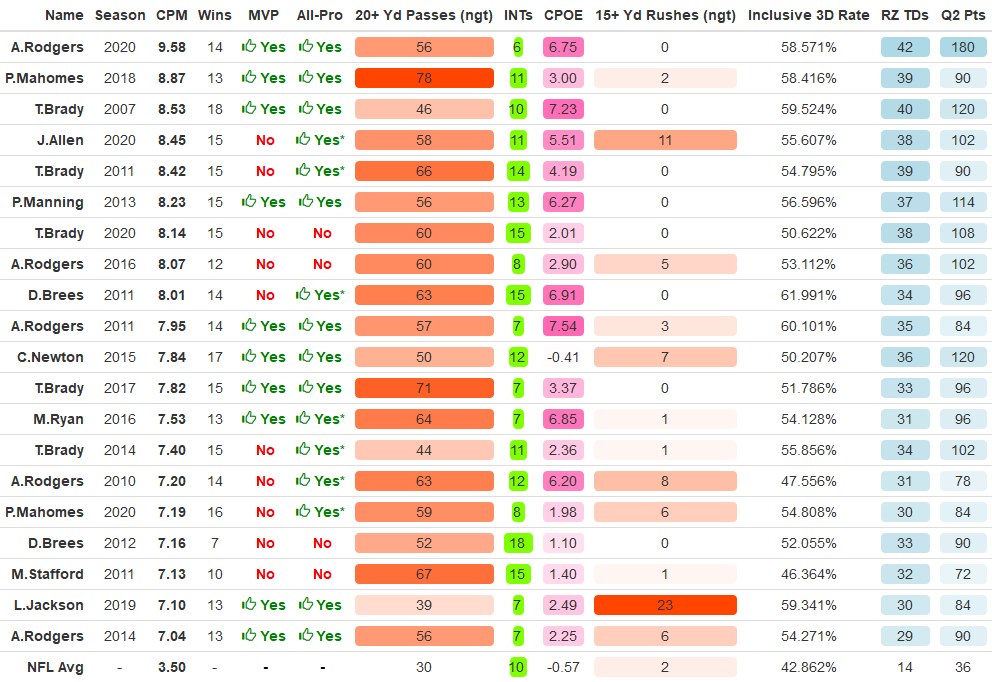
Where to start? Since 2006, 13 quarterbacks have been named NFL MVP. A whopping 10 are in our top 20, including each of the last nine winners. Even from the holdouts, 2009 Peyton Manning comes in at No. 24 and 2010 Tom Brady at No. 39 — still very high in the set of 619 qualified QB seasons over that span. Furthermore, every passer in the top 20 either made an All-Pro team (with asterisks showing non-AP first team) or missed out to somebody else on the list. Additionally, we see that list of dominant quarterbacks that have defined the last 15 years of the NFL, as well as how they did it.
What is next for our Comprehensive Passing Metric?
Over the coming weeks and months, stay tuned to The 33rd Team as we talk about which QBs have been the best so far in 2021, including which rookies are actually getting off to the best start this season.
For other questions or ideas, feel free to email Peter Engler at zapengler@gmail.com