NFL Analysis
6/16/22
11 min read
The State of NFL Free Agency: Part 2
Study by Jamie Kelly
In Part 1 of this series, we ran over the rationale for this study of high-profile NFL Free Agent transactions between 2015-2019, the methodology that was used, and presented the results for Quarterback, Running Back, Wide Receiver, and Tight End.
In Part 2, we’ll be focusing on the Offensive and Defensive Lines and how well players from these positional groups performed before FA, and then how well they did after their lucrative contract was signed. We’ll seek to uncover where value can be found at each position and see if there are any trends that teams and the NFL community at large can learn from.
Offensive Line
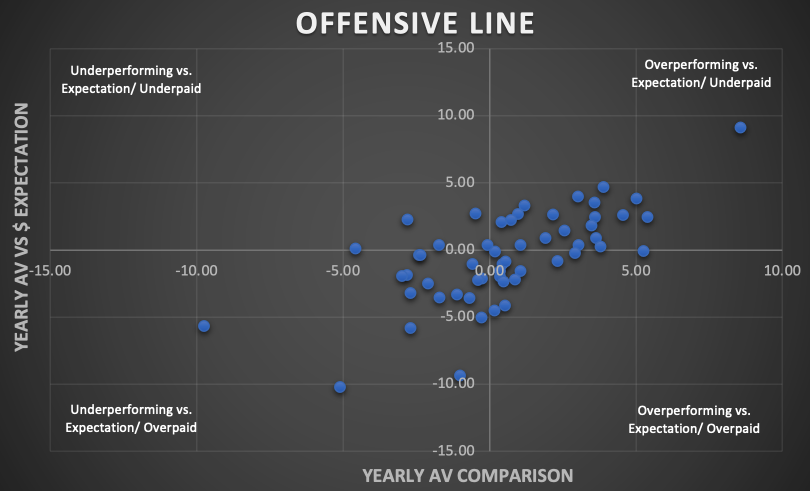
We’ll break this group into OTs and IOLs in a moment, but to get a complete view for OL transactional effectiveness, here’s the visualized summary of all 55 OL players analyzed in this study.
Offensive Tackles
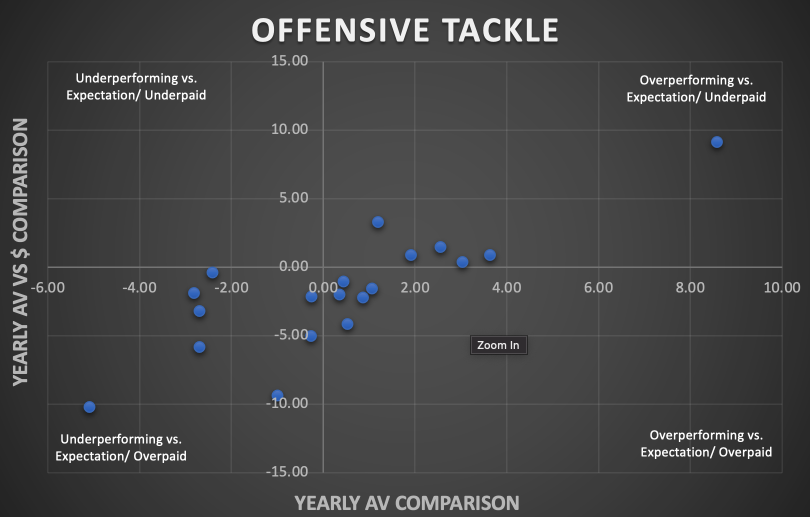
Overview
The OT group was one of the youngest positional groups in this study with the 19 players averaging out at just 5 pre-FA NFL seasons. Andrew Whitworth (11) was the only player with 8 or more seasons that met the required criteria.
Draft status tended to be quite polarized with 6 seventh round picks and UDFAs combined, and 9 first and second-round picks combined.
School was also an important factor here with 14 of the 19 transactions given to players from Power 5 colleges.
OT FA Statistics
- 7 of the 19 players included in this study completed their FA contract (including Mitchell Schwartz who renegotiated for higher pay after 3 years)
- Only 4 of the 19 players was still on the acquiring team the year after his contract ended (Schwartz, Bobby Massie, Whitworth, Chris Hubbard)
- 11/19 had positive Yearly AV vs expectation values – showing clear trend that OL improve with age
- 6/19 had positive Yearly AV vs $$$ expectation values
- + 0.37 Yearly AV vs. expectation for the whole group
- - 1.74 Yearly AV $ vs. expectation for the whole group
When do OTs work out?
To be a successful OT Free Agent, prior production isn’t essential. Chris Hubbard and Jeremy Parnell both received positive yearly AV improvement and AV vs $ expectation despite starting only 14 games and 7 games respectively before hitting FA. In some ways, modest pre-FA production was the reason the top 2 players from a metric standpoint performed so well; both Mitchell Schwartz (6.25) and Bobby Massie (5.25) had adjusted yearly AV figures below 7, but both increased post-FA, with Schwartz soaring to 14.67 a year, and Massie contributing a respectable 6.33 for his $6m a year average contract.
Andrew Whitworth’s sterling stint with Rams however showed having age and solid production on your side before FA is still valuable as he improved his yearly AV output from a very competitive 8.73 to 10.33. This was after he signed on with the Rams at age 36!
When do OTs NOT work out?
The combination to look out for is modest production and a decent number of starts. Only 1 of the 13 with negative Yearly AV vs $ comparison had a pre-FA average over 7 (Nate Solder). In fact, this group averaged just 4.66 yearly AV and 54 pre-FA starts between them.
Size, draft status, and age seem to have limited impact on the outcomes for OTs.
Best FA signing
Mitchell Schwartz to the Chiefs in 2016. Signing a 5-year, $33m was a masterstroke by the Chiefs. His play improved pre-FA to post-FA by 8.58 AV a year! This was one of the highest in the whole study. His yearly AV vs. $ expectation was also an incredible 9.12, again one of the highest scores regardless of position. He outperformed his contract so much he was rewarded with a pay rise after Year 3. Unfortunately, injuries derailed his successful run beyond the time frame of his initial KC contract.
Worst FA signing
Ja'Wuan James to Denver in 2019. Injuries played a huge factor here. However, a total FA contract output of 1, on a 4-year, $51m contract was a disaster for the Broncos.
Interior Offensive Line
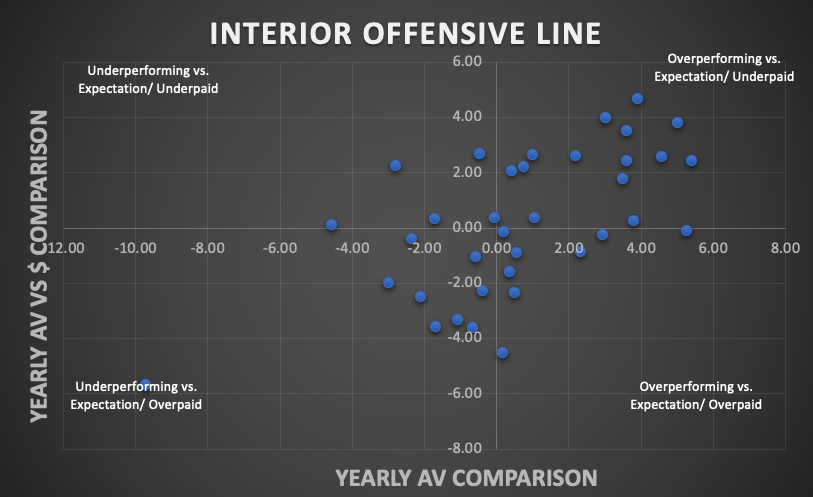
Overview
The most effective positional group of any, Interior Offensive Line, is one the few groups that produced positive average scores in both our key metrics.
In a similar fashion to OT, this group tends towards the young side, averaging just 5.08 pre-FA NFL seasons, with only 1 of the 36 IOLs included in this study having suited up for 3 or more teams.
Size and draft status is all over the map, with plenty of early-, mid-, and late-round picks spread throughout this dataset.
IOL FA Statistics
- 11 of 36 players included in this study completed their FA contract (including 5 who renegotiated for higher pay plus Justin Pugh who has yet to complete or be released from his FA contract with ARI)
- 8 of the 36 players was still on the acquiring team the year after his contract ended
- 22/36 had positive Yearly AV vs expectation values
- 19/36 had positive Yearly AV vs $$$ expectation values
- + 0.63 Yearly AV vs. expectation for the whole group
- + 0.18 Yearly AV $ vs. expectation for the whole group
When do IOL work out?
Experience seems to be a positive factor for success with those players receiving positive yearly AV vs. $ expectation scores having an average of 5.2 pre-FA NFL seasons vs. the negative-producing group having just 4.9 pre-FA NFL seasons.
OCs seem to be the safest bet of any position included in this study. Of the 9 OCs included, 4 performed so well as to deserve new contracts at a higher average per year (Rodney Hudson to OAK, Ben Jones to TEN, Mike Pouncey to LAC, J.C. Tretter to CLE). In addition, 3 others completed their contract with positive grades in our two metrics (Alex Mack to ATL, Ryan Jensen to TB, Matt Paradis to CAR). Mitch Morse has been solid with BUF, improving his AV average by 0.48, however his AV vs $ expectation has been below the line at -2.34. Only Weston Richburg to SF could be viewed as a definitive bad transaction of the 9 OCs.
When do IOL NOT work out?
The results here don’t favor paying IOLs over $9m a year. Even with good signings like Alex Mack to ATL and Ryan Jensen to TB, and solid ones like Roger Saffold to LAR and Kelechi Osemele to OAK propping up these high earners, the group averaged out at -1.75 yearly AV vs. $ expectation.
Beyond that, it didn’t appear that any background made a IOL any more or less likely to be a success post-FA.
Best FA signing
For Centers, Alex Mack to ATL in 2016. While a 5-year, $45m contract was hefty for an OC at the time, his +3.83 yearly AV vs. Expectation proved he was worth it. He stepped up his overall game as well, increasing his Yearly AV output by 5.02 a year vs. his pre-FA contribution.
For Guards, Brandon Brooks to PHI in 2016. A bargain 5-year, $40m deal took Brooks from HOU to PHI, and he was worth every penny, returning a +2.61 yearly AV vs $ expectation. He renegotiated his contract after 3 years for a significant pay rise.
Worst FA signing
JR Sweezy to TB in 2016. While he’s become a solid player since, JR Sweezy’s time in TB didn’t produce to expectation. He was released 2 years into a 5-year, $32.5m deal, in which his yearly AV was -2.99 and his yearly AV vs. $ expectation was a lowly -1.97.
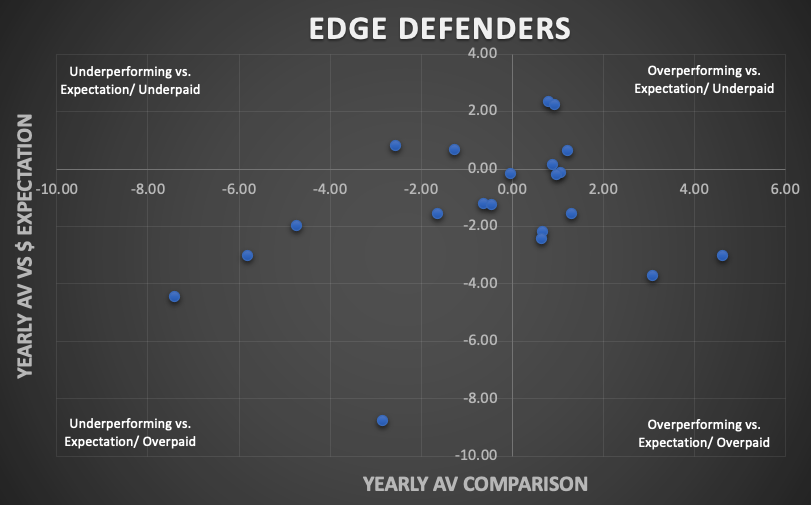
Edge Defenders
Overview
EDGE defenders hit the market generally a little later than their offensive line colleagues. The average of the 21 EDGEs included in this study was 5.7 Pre-FA NFL seasons, 1.23 Pre-FA teams and an average age of 28.5.
This group tends to be early-round draft picks, with no sixth- or seventh-round draft picks and only two UDFAs in this group.
EDGE FA Statistics
- 6 of 21 players included in this study completed their FA contract
- Only 1 of the 21 players were still on the acquiring team the year after his contract ended
- 11/21 had positive Yearly AV vs expectation values
- 5/21 had positive Yearly AV vs $$$ expectation values
- - 0.53 Yearly AV vs. expectation for the whole group
- - 1.36 Yearly AV $ vs. expectation for the whole group
When do EDGEs work out?
From this dataset, it emerges that high-draft picks (the first two-rounds) tend to produce the best results in Yearly AV vs $ expectation, with players such as Brian Orakpo, Trent Murphy and Jabaal Sheard doing solid jobs with their respective new teams.
Prior production surprisingly doesn’t appear to be a significant factor, as those defenders with negative Yearly AV vs. $ expectation results had 5.32 average AV pre-FA vs. 5.5 for those with positive results.
Athletic profile produces some small impact, with positive Yearly AV vs. $ expectation graders, having a RAS of 7.33 vs. 6.82 for those with negatives.
When do EDGEs NOT work out?
Age seems to be a significant negative factor. Of the group who negatively scored in our Yearly AV vs. $ expectation metric, the average age was 29, vs. 27.5 for those with a positive result. For those players aged 30 or over at the time of signing their Yearly AV comparison average was -2.71 vs. +0.34 for the under 30s, and in Yearly AV vs. $ expectation, the over 30s averaged -2.02 vs -1.10 for the under 30s.
This would suggest buyer beware for aging, previously productive EDGE defenders in FA.
Best FA signing
There weren’t many standout signings from this EDGE group, but we’ve gone for Brian Orakpo to TEN in 2015. A productive time in WAS, earned him a 4-year, $31m contract with TEN (at age 29) and he continued to be a solid performer. It goes against the grain a little vs. what just discussed but Orakpo appears an anomaly. His yearly AV increased by 0.93 post-FA, and his yearly AV vs. $ expectation was a solid 2.26 during his Titans’ stint.
Worst FA signing
Trey Flowers to DET in 2019. This one surprisingly didn’t work out. A very good player going to play in a familiar scheme with a familiar DC, and yet his production fell off a cliff. Injuries were a key factor in Flowers’ post-FA decline, with his yearly AV comparison post-FA at -2.85. But it was the high price that really cost the Lions on this one, with his 5-year, $90m contract, combining with a -8.76 yearly AV vs. $ expectation.
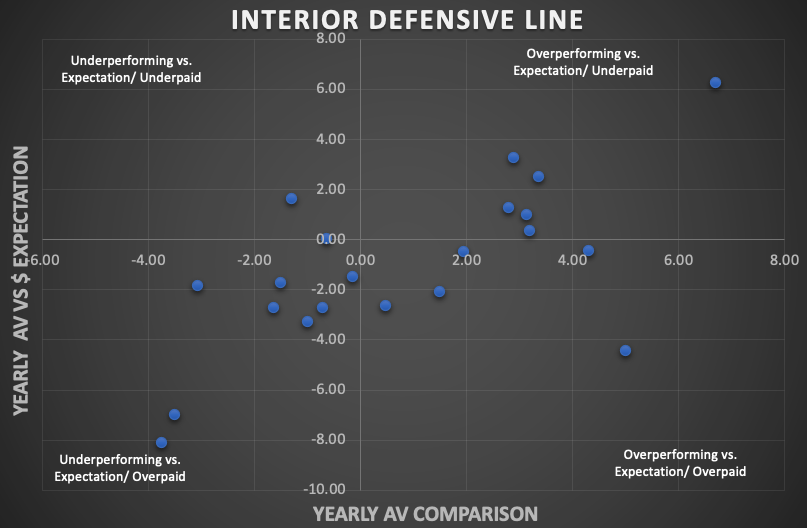
Interior Defensive Line
Overview
The IDL group includes a real mix bag in terms of young/ inexperienced players and experienced travelers. 4 of the 21 had played on 3 or more teams before their FA. 10 of the 21 fell into the 414 or 515 groups of first-time Free Agents who had played 4 NFL seasons, with 1 NFL team for all 4 NFL seasons.
Draft-status really didn’t matter for IDLs. With 9 of the 21 being fifth-, sixth-, or seventh-round picks or UDFAs. For comparison, 8 of the 21 came from the first and second rounds.
Interior Defensive Line FA Statistics
- 4 of 21 IDLs included in this study completed their FA contract (including Akiem Hicks who was given a contract extension/ pay rise before his contract ended)
- 3 of the 21 IDLs were still on the acquiring team the year after his contract ended
- 11/21 had positive Yearly AV vs expectation values
- 7/21 had positive Yearly AV vs $$$ expectation values
- + 0.86 Yearly AV vs. expectation for the whole group
- - 1.06 Yearly AV $ vs. expectation for the whole group
When do IDL work out?
Late-round hustle appears to be a significant-pointer to success in this group. Of the top-7 scorers in Yearly AV vs. $ expectation, we had 2 third-rounders, 2 seventh rounders, and 3 UDFAs.
When do IDL NOT work out?
Experience isn’t everything when determining success for IDLs. Negative graders in yearly AV vs. $ expectation averaged 55.6 starts, vs. a 45.75 start average for those with positive results. Output pre-FA also doesn’t appear to be a reliable factor for post-FA success, with positive grades averaging 4.47 Pre-FA Yearly AV vs. negative graders averaging 5.88.
Best FA signing
Lawrence Guy to NE in 2017. An excellent value pick-up by NE for the former seventh-round pick who’d played for 4 NFL franchises before landing in NE. His 4-year, $14.4m contract turned out to be a huge bargain, as his yearly AV jumped post-FA by 6.69, and his yearly AV vs. $ expectation came out at a thoroughly impressive 6.27.
Worst FA signing
Malik Jackson to PHI in 2019. Coming off a huge contract in JAX, where he did show flashes, Jackson’s time in PHI was pretty underwhelming. He signed a 3-year, $30m contract with PHI, but delivered just 4 AV in a two-year period, resulting in a -3.51 Yearly AV comparison and a -6.96 Yearly AV vs. $ expectation.
We’ll return in Part 3, where we’ll be examining LBs and DBs, before completing the series with a look at how individual teams have fared across these transactions.