Analysis
4/20/23
5 min read
Jimmy Johnson's Draft Trade Value Chart Set Standard, But Is Clearly Outdated
When NFL Draft Day trades are made, charts assigning numerical values to draft positions often are employed to evaluate the worth of picks. There are several out there, but only one is — and has been — used most by NFL clubs.
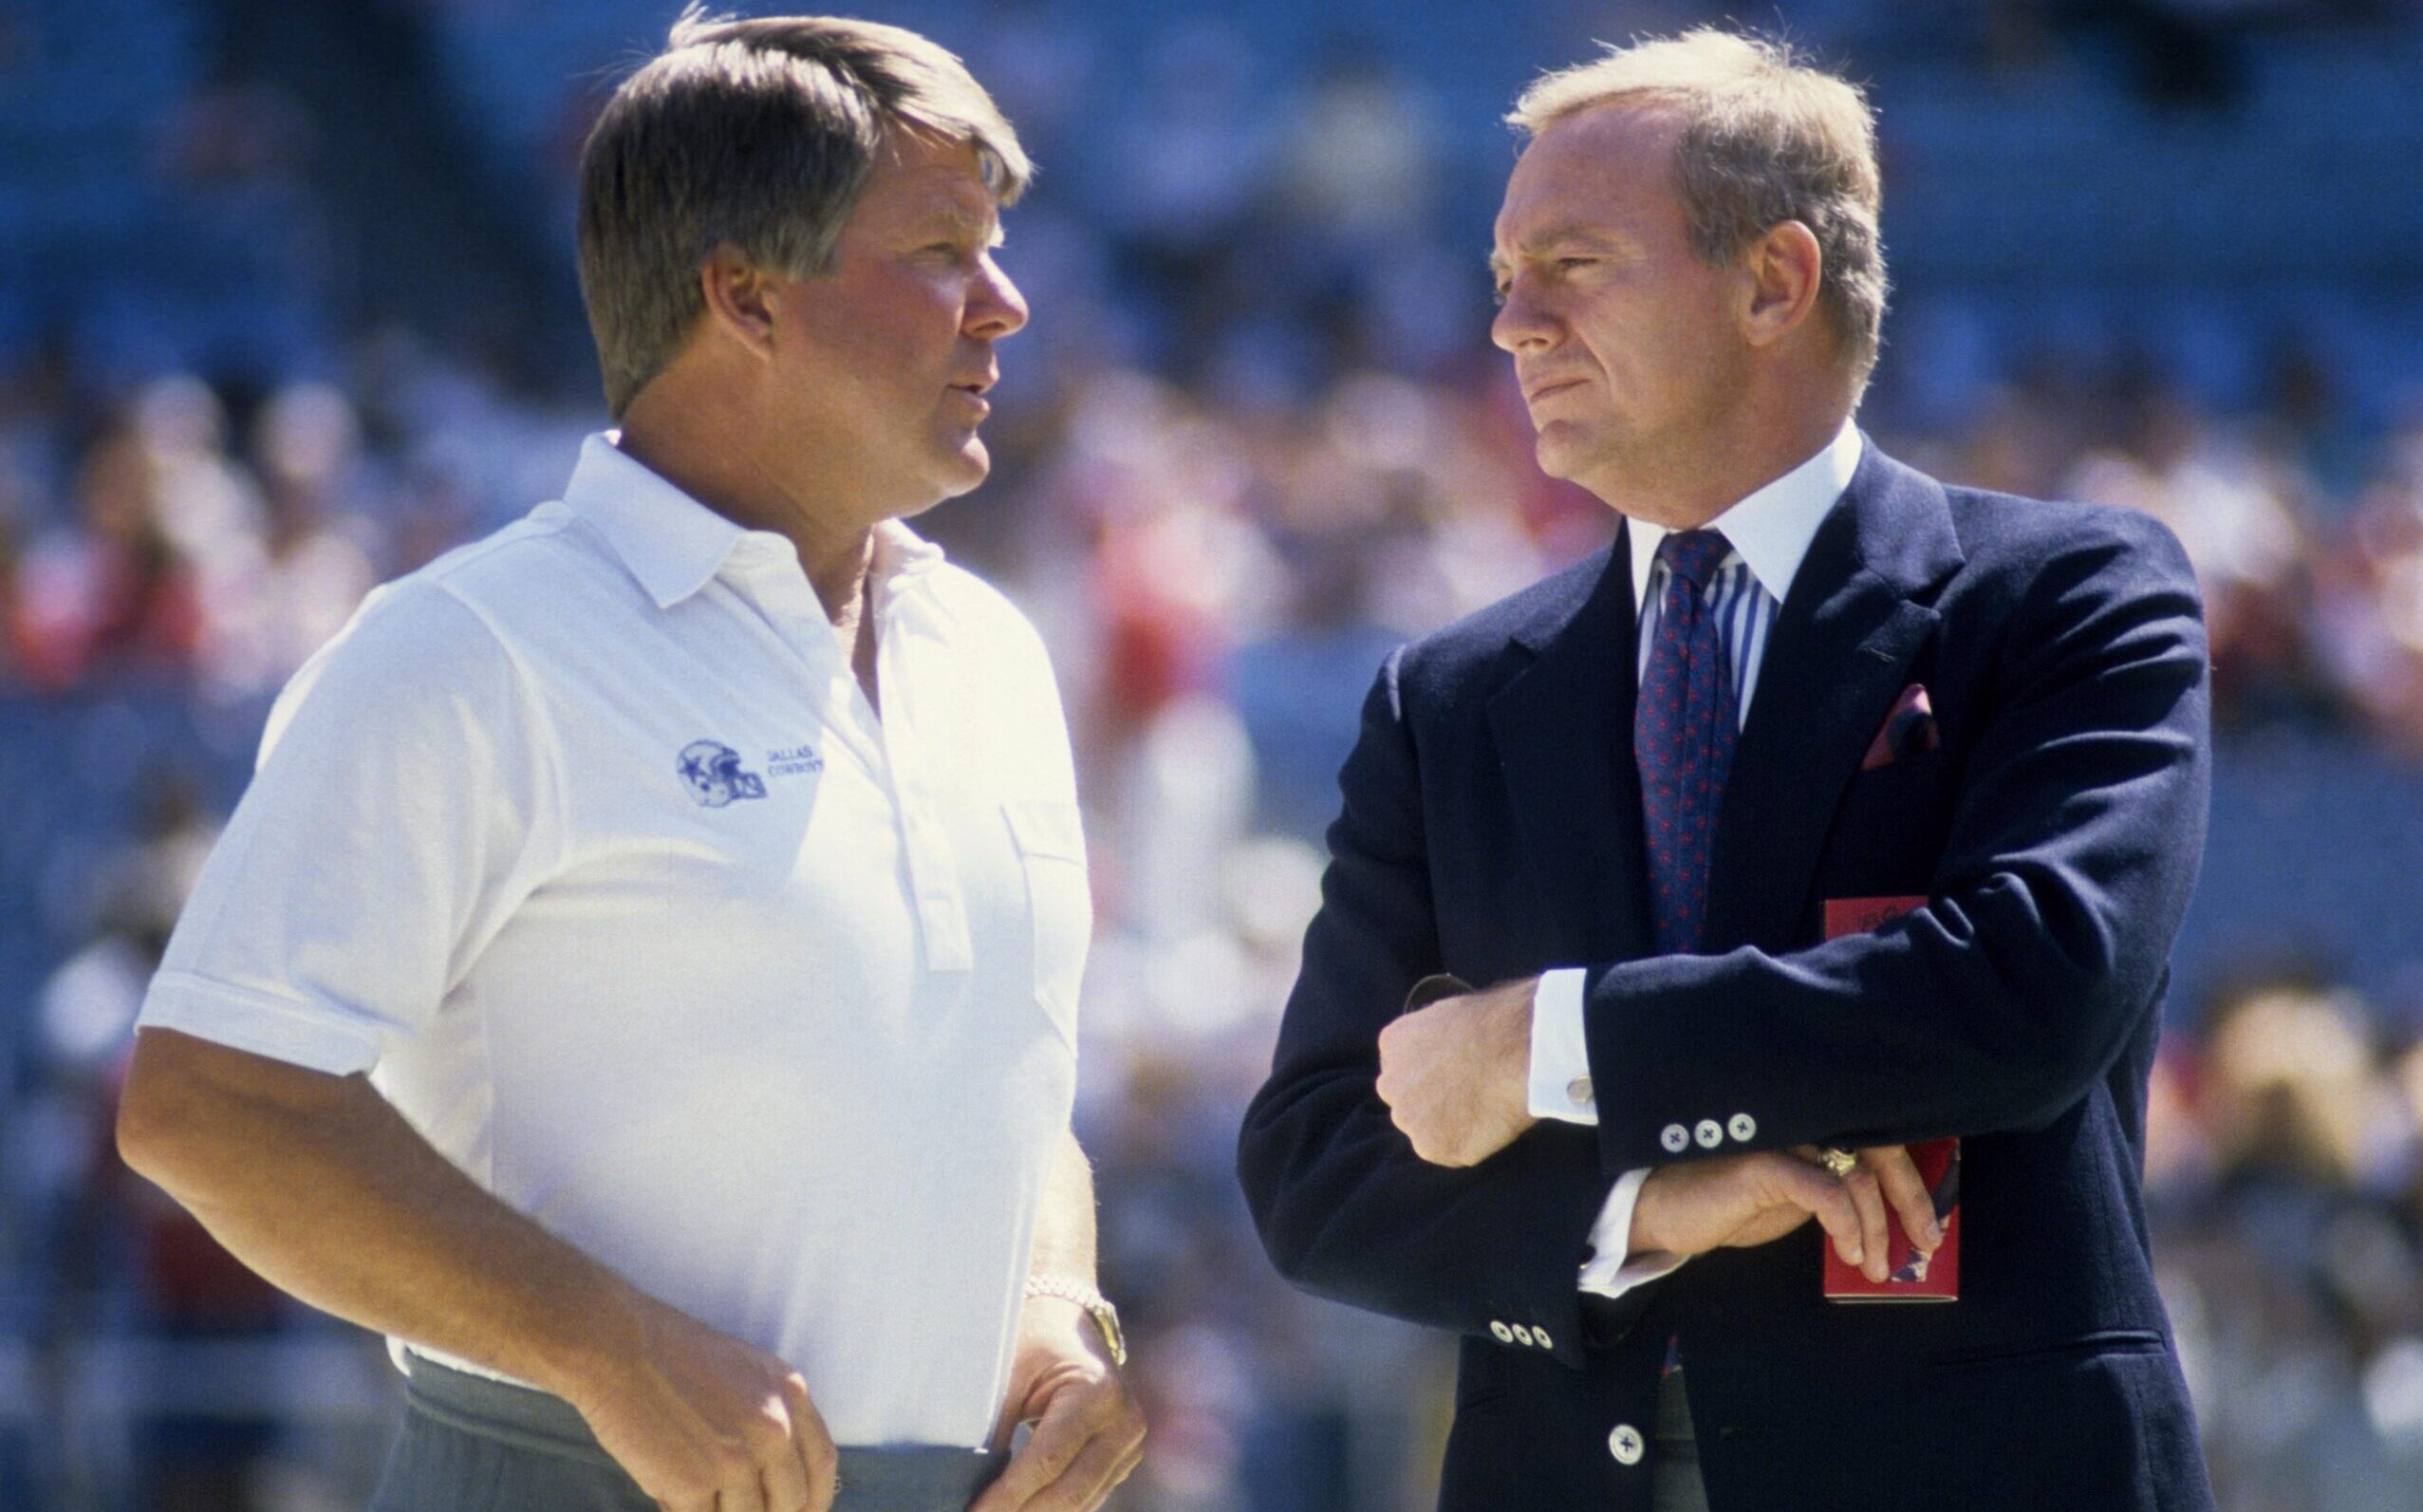
That would be the Jimmy Johnson trade value chart that the Hall of Fame coach devised in the 1990s.
It was as brilliant as it was groundbreaking, assigning the largest numerical values to the highest picks, and it was used by everyone. And for good reason: It made life simple when evaluating the fairness of trades involving draft picks. You knew when you were on the phone talking about a possible deal that you and your potential trade partner were looking at the same chart.
It was a game-changer then. But it is obsolete now.
OK, not completely. Johnson’s trade value chart was created three decades ago in a vastly different world order. It made sense when the top half of the first-round commanded gazillion-dollar contracts, but that changed with the 2011 collective bargaining agreement. It created a rookie pay scale that dramatically affected compensation at the top half of the first round and moderately affected it at the bottom.
But it did more than that. It diminished the value of Johnson’s trade chart, too.
That’s because it was created nearly 20 years prior to the 2011 CBA when first-round picks – especially No. 1 choices – gained monstrous deals before playing a down. In 2007, for instance, the Raiders signed quarterback JaMarcus Russell, the first overall choice, to a six-year, $68 million deal, making him one of the NFL’s highest-paid players. Three years later, the St. Louis Rams made No. 1 pick Sam Bradford the richest rookie ever with a $76 million deal.
That ended with the 2011 CBA, and I should know. I was the only person outside of people who worked for the league office who was one of its negotiators. By modifying compensation, especially at the top end of the first round, the CBA allowed teams to spend more on veteran players instead of having to use that money to write off lost cap charges if they missed on a top-15 choice.
That was a big deal, and it should be factored into a trade value chart. And it has been … except not by Jimmy Johnson.
Johnson's Draft Trade Value Chart
The value of every pick in the draft to help teams quickly evaluate the fairness of trades (does not include compensatory picks), as developed by Cowboys coach Jimmy Johnson in the early 1990s:
| Round 1 | Round 2 | Round 3 | Round 4 | Round 5 | Round 6 | Round 7 | |||||||
| 1 | 3,000 | 33 | 580 | 65 | 265 | 97 | 112 | 129 | 43 | 161 | 27 | 193 | 14.2 |
| 2 | 2,600 | 34 | 560 | 66 | 260 | 98 | 108 | 130 | 42 | 162 | 26.6 | 194 | 13.8 |
| 3 | 2,200 | 35 | 550 | 67 | 255 | 99 | 104 | 131 | 41 | 163 | 26.2 | 195 | 13.4 |
| 4 | 1,800 | 36 | 540 | 68 | 250 | 100 | 100 | 132 | 40 | 164 | 25.8 | 196 | 13 |
| 5 | 1,700 | 37 | 530 | 69 | 245 | 101 | 96 | 133 | 39.5 | 165 | 25.4 | 197 | 12.6 |
| 6 | 1,600 | 38 | 520 | 70 | 240 | 102 | 92 | 134 | 39 | 166 | 25 | 198 | 12.2 |
| 7 | 1,500 | 39 | 510 | 71 | 235 | 103 | 88 | 135 | 38.5 | 167 | 24.6 | 199 | 11.8 |
| 8 | 1,400 | 40 | 500 | 72 | 230 | 104 | 86 | 136 | 38 | 168 | 24.2 | 200 | 11.4 |
| 9 | 1,350 | 41 | 490 | 73 | 225 | 105 | 84 | 137 | 37.5 | 169 | 23.8 | 201 | 11 |
| 10 | 1,300 | 42 | 480 | 74 | 220 | 106 | 82 | 138 | 37 | 170 | 23.4 | 202 | 10.6 |
| 11 | 1,250 | 43 | 470 | 75 | 215 | 107 | 80 | 139 | 36.5 | 171 | 23 | 203 | 10.2 |
| 12 | 1,200 | 44 | 460 | 76 | 210 | 108 | 78 | 140 | 36 | 172 | 22.6 | 204 | 9.8 |
| 13 | 1,150 | 45 | 450 | 77 | 205 | 109 | 76 | 141 | 35.5 | 173 | 22.2 | 205 | 9.4 |
| 14 | 1,100 | 46 | 440 | 78 | 200 | 110 | 74 | 142 | 35 | 174 | 21.8 | 206 | 9 |
| 15 | 1,050 | 47 | 430 | 79 | 195 | 111 | 72 | 143 | 34.5 | 175 | 21.4 | 207 | 8.6 |
| 16 | 1,000 | 48 | 420 | 80 | 190 | 112 | 70 | 144 | 34 | 176 | 21 | 208 | 8.2 |
| 17 | 950 | 49 | 410 | 81 | 185 | 113 | 68 | 145 | 33.5 | 177 | 20.6 | 209 | 7.8 |
| 18 | 900 | 50 | 400 | 82 | 180 | 114 | 66 | 146 | 33 | 178 | 20.2 | 210 | 7.4 |
| 19 | 875 | 51 | 390 | 83 | 175 | 115 | 64 | 147 | 32.6 | 179 | 19.8 | 211 | 7 |
| 20 | 850 | 52 | 380 | 84 | 170 | 116 | 62 | 148 | 32.2 | 180 | 19.4 | 212 | 6.6 |
| 21 | 800 | 53 | 370 | 85 | 165 | 117 | 60 | 149 | 31.8 | 181 | 19 | 213 | 6.2 |
| 22 | 780 | 54 | 360 | 86 | 160 | 118 | 58 | 150 | 31.4 | 182 | 18.6 | 214 | 5.8 |
| 23 | 760 | 55 | 350 | 87 | 155 | 119 | 56 | 151 | 31 | 183 | 18.2 | 215 | 5.4 |
| 24 | 740 | 56 | 340 | 88 | 150 | 120 | 54 | 152 | 30.6 | 184 | 17.8 | 216 | 5 |
| 25 | 720 | 57 | 330 | 89 | 145 | 121 | 52 | 153 | 30.2 | 185 | 17.4 | 217 | 4.6 |
| 26 | 700 | 58 | 320 | 90 | 140 | 122 | 50 | 154 | 29.8 | 186 | 17 | 218 | 4.2 |
| 27 | 680 | 59 | 310 | 91 | 136 | 123 | 49 | 155 | 29.4 | 187 | 16.6 | 219 | 3.8 |
| 28 | 660 | 60 | 300 | 92 | 132 | 124 | 48 | 156 | 29 | 188 | 16.2 | 220 | 3.4 |
| 29 | 640 | 61 | 292 | 93 | 128 | 125 | 47 | 157 | 28.6 | 189 | 15.8 | 221 | 3 |
| 30 | 620 | 62 | 284 | 94 | 124 | 126 | 46 | 158 | 28.2 | 190 | 15.4 | 222 | 2.6 |
| 31 | 600 | 63 | 276 | 95 | 120 | 127 | 45 | 159 | 27.8 | 191 | 15 | 223 | 2.3 |
| 32 | 590 | 64 | 270 | 96 | 116 | 128 | 44 | 160 | 27.4 | 192 | 14.6 | 224 | 2 |

I’m not bashing his chart. It was brilliant. But it’s outmoded. In fact, when I was with the Philadelphia Eagles, we devised our own trade value chart. It was based on what we thought variations should be with cap and cash implications being so different for first-round picks from what they were before 2011.
It was invaluable to us. We didn’t make a move or trade we thought wasn’t at least reasonably close in value to what our chart said, and we shared it with no one.
While it varied drastically from Jimmy’s at the top of the first round and less substantially at the bottom, it wasn’t all that different from the second round on. I know other teams have their own charts, too, factoring in things that changed with the 2011 CBA. But, in our case, we had positions we cared about more than others. So that could affect what our chart advised vs. what we actually did. What I’m saying is we sometimes deviated from it, depending on how anxious we were to complete a deal.
Let’s say, for instance, we thought about trading up for a difference-making pass rusher. Then, we might consciously overpay if we believed he could make a significant impact. By the same token, we might underpay if we were looking at a guard or safety at the bottom of the round. If you lost out on one or the other, we believed you could find another in the second or third rounds. So we could fluctuate on how adamant or immovable we were with our chart depending on how important we thought a certain position was.
The bottom line is this: Times have changed with draft trades, and charts should, too, because some basic, obvious things have changed since the Jimmy Johnson chart was created. Honestly, I don’t think anyone should be using it today because so much of what it was based on is different. If they haven’t already, teams should be developing new charts or, at the very least, have their own revised version of Jimmy’s chart.
And if they don’t? Then they’re just lazy and not thinking strategically. It’s that simple.
Joe Banner is a former front office executive for the Philadelphia Eagles and Cleveland Browns. He was part of an Eagles franchise that made a Super Bowl and played in four NFC Championship Games. Follow him on Twitter at @JoeBanner13