Analysis
10/28/22
5 min read
Which Running Backs Are Hitting the Hole Most Consistently in 2022?
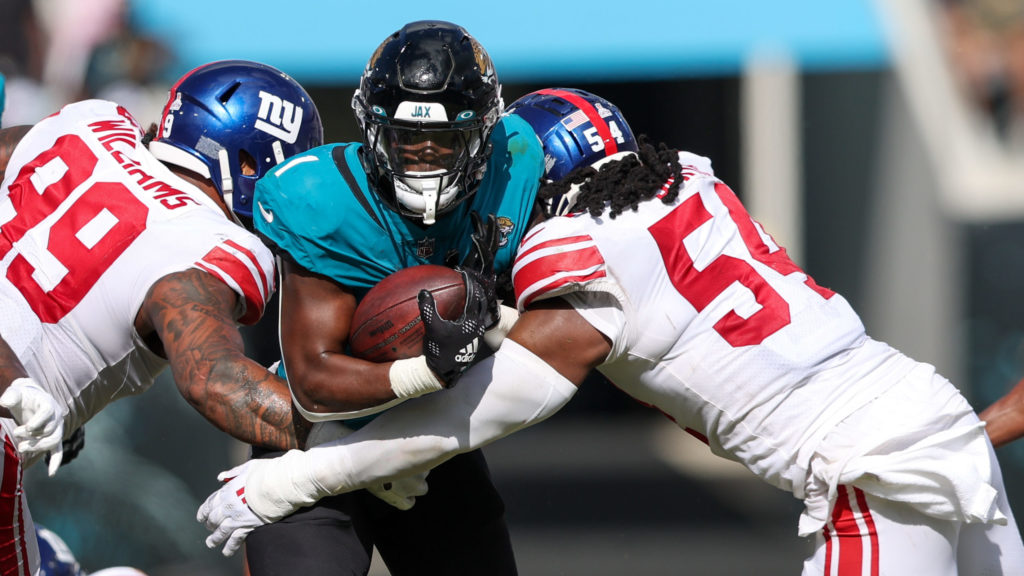
On the Off the Charts podcast episode from this week, the SIS research staff discussed how Saquon Barkley has had a much more successful season so far in his second year returning from a Grade 3 ACL tear. He’s leading the league in carries and averaging a yard after contact more per carry than he was in 2021.
In part, he’s having success because he’s running with conviction, and he is able to do so because of an improved offensive line. He’s run through the designed gap on 90% of gap scheme runs this season, which is one of the highest rates in the league.
Designed Gap Percentage Leaders, 2022 Gap Scheme Runs
(min. 20 gap scheme carries)
| Player | Designed Gap % |
| Travis Etienne | 90% |
| Saquon Barkley | 90% |
| J.K. Dobbins | 88% |
| Clyde Edwards-Helaire | 88% |
| Breece Hall | 87% |
Explaining Designed Gap %
Let’s take a bit of time to talk about that number.
First off, the data involved. Video Scouts from SIS chart every run play with various elements, but the three we care about in this case are:
- Blocking Scheme: The style of blocking done by the offensive line as a whole. We tend to group together multiple blocking schemes to simplify it to “zone” and “gap” categories.
- Initial Run Direction: The direction the run was designed to go, based on the initial action of the blockers and running back. We refer to this in terms of which gap between linemen the runner was targeting.
- Actual Run Direction: The direction the runner actually went, again in terms of which gap he went through.
So, when we say Barkley has run through the designed gap on 90% of gap scheme runs, that means that he is nearly always running in the direction the blocking was designed to support. That’s a good bit more than average, which tends to be just above 70%.
The Benefits of Hitting the Hole
Of course, running through the designed gap (especially on gap scheme runs) can tell you something about the blocking as well. Even a player like Barkley or Travis Etienne who has incredible ability to make plays with agility is going to prefer an open hole when it’s available. You’re getting downhill faster and making contact with defenders later in the play.
In 2021, 25 out of 32 teams did better on gap scheme runs when they went through the designed gap (in terms of yards before contact per carry).
Barkley’s 90% rate stands out not just in terms of the league average, but his own tendencies from previous seasons.
The previous two years, he had used the designed gap below 70% of the time on gap scheme runs. In 2019, he averaged 6.8 yards per carry when he bounced or cut back on a gap scheme run (6.3 when he hit the hole). When you’re peak Saquon Barkley you can get away with what might be suboptimal for other players. But in 2021 the script flipped, and he was better on runs to the designed gap, as would be the case for the average player.
A Murkier Picture for Zone Runs
On zone runs, the story is a bit more complicated. Zone blocking is designed to give the rusher an opportunity to read the play as it happens, and bounces and cutbacks are more encouraged. As a result, zone runs only tend to go through the designed gap on about 64% of plays.
Going back to the yards before contact stat from above, on zone scheme runs in 2021 only 14 out of 32 teams did better when they went through the designed gap.
Some of the leaders in hitting the designed hole on zone runs are familiar from the list above. Clyde Edwards-Helaire and Breece Hall have taken what the design gives them regardless of the blocking scheme.
Designed Gap Percentage Leaders, 2022 Zone Scheme Runs
(min. 20 zone scheme carries)
| Player | Designed Gap % |
| Clyde Edwards-Helaire | 80% |
| Khalil Herbert | 78% |
| Devin Singletary | 77% |
| Aaron Jones | 76% |
| Breece Hall | 75% |
The Pack’s Backs
Aaron Jones is an interesting case from the above list because of how he contrasts with his teammate, A.J. Dillon. Dillon has not been particularly productive in 2022, and it might have to do with the numbers below. This season, Jones has been staying within the concept of the offense much more often than Dillon, which is reflective of a change in opposite directions for both backs.
Designed Gap % by Blocking Scheme, Packers' Backfield, 2021
| Jones | Dillon | |
| Gap Scheme | 55% | 76% |
| Zone Scheme | 55% | 58% |
Designed Gap % by Blocking Scheme, Packers' Backfield, 2022
| Jones | Dillon | |
| Gap Scheme | 71% | 50% |
| Zone Scheme | 76% | 44% |
The end result for the team has been similar — its overall rush offense is basically as productive as last year — but the younger and presumed-ascending Dillon has started to cede playing time in part because of this sort of thing.
Prepared by Alex Vigderman


