Analysis
7/31/22
7 min read
Advanced Analytical Study on Two Point Conversions
Two-point conversions are some of the most impactful plays on the football field.
While they may seem simple, the randomness of two-point success rates and myriad situational differences create a complicated decision.
My goal is first to simplify the decision-making process and create a model more accurate than current public models to predict two-point success rate.
The Math behind Going for Two
While the first instinct when determining whether or not a team should go for two may be to calculate the expected points, there is one major caveat: not every point is created equal.
This is why we should use win probability to create our equation.
wp_1*xp + wp_0*(1-xp) < wp_2*twop + wp_0*(1-twop)
wp_0 = Win probability if team scores 0 points

wp_1 = Win probability if team scores 1 point

wp_2 = Win probability if team scores 2 points

xp = Percentage chance of converting an extra point attempt

twop = Percentage chance of converting a two point attempt
The equation above displays that when the win probability of going for two is greater than kicking an extra point a team should go for two. This equation can be further simplified to the equation below, isolating the two pt conversion chance required to go for two.
((wp_1 - wp_0) * xp) / (wp_2 - wp_0) < twop
Building a Two Point Model
Creating an accurate two-point conversion model is tough due to the random nature of two-point attempts. The only public model predicting two-point conversions is part of Ben Baldwin’s 4th down package in nflfastR. Unlike his 4th down model, however, his two-point conversion model isn’t very accurate with a correlation between his predictions and actual results of just 0.0116. The AUC between his predictions and actual results was just 0.52.
Baldwin’s model likely put a lot of emphasis on the offense and defense’s general strength. When building my model I wanted to use Ben Baldwin’s model as a factor, as a way of encompassing team strength and the rest of the factors he used into one. I then wanted to emphasize the impact of past success in similar situations on predicting two-point conversions by creating some of my own factors. For all two-point attempts, I calculated the offense and defense’s success rate on those plays to that point in the game, as well as to that point in the season. I then filtered plays on 3rd or 4th down that were 1, 2, or 3 yards in length, and did the same.
The season-long conversion rates of short yardage plays for both the team on offense and defense had big sample sizes which is why they ended up being two of the most important factors in the model.
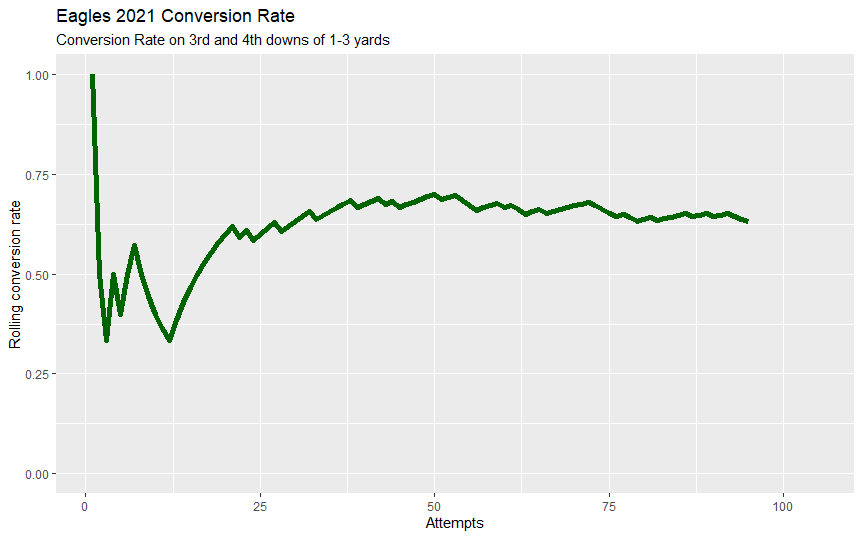
The picture above displays the 2021 Philadelphia Eagles rolling conversion rate on short yardage plays progression throughout the season.
READ MORE: How Super Bowl Champions Deft NFL Trends
Another pair of factors that I wanted to consider was the offense and defense’s short yardage conversion rate in the last n number of plays. I suspected that if a team that had converted their last few short-yardage plays they would have an advantage. I was still unsure of what to use as my value for n. If n is too low, I risk having a small sample size. If n is too high, the number doesn’t represent whether the team has done well recently.
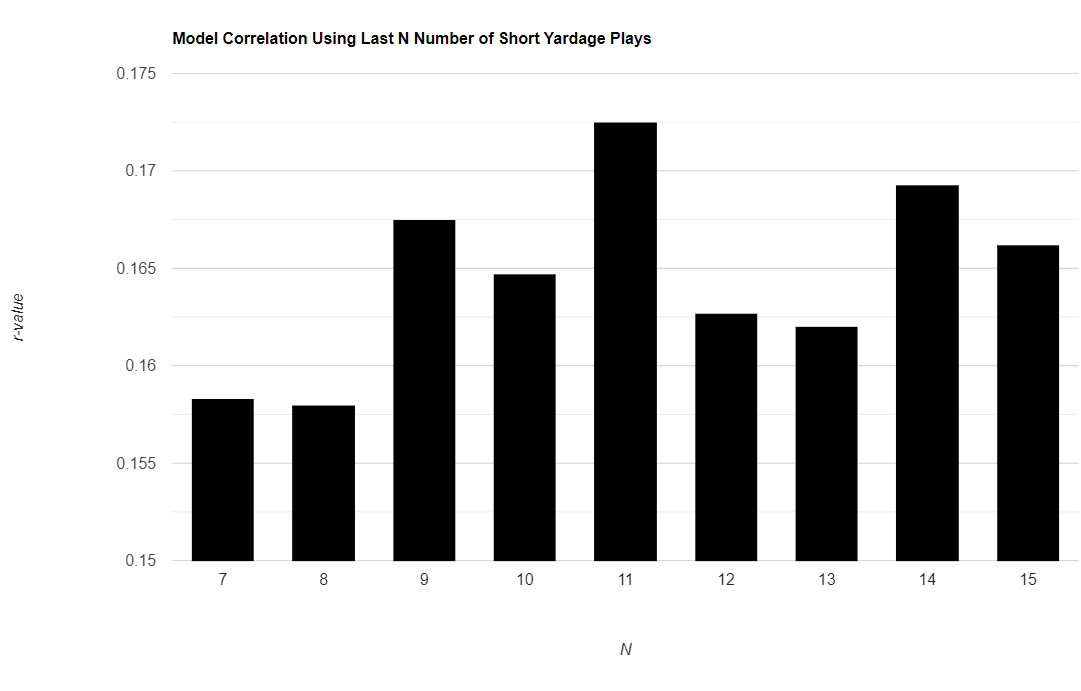
The picture above displays that using the last 11 plays as a factor creates the most predictive model. In total, the model had eleven factors it used to predict the success of a two-point conversion.
These factors were
-
In game short yardage play (3rd/4th downs 1-3 yds) success rate
-
In season 2pt success rate
-
In season 2pt success rate allowed by defense
-
In season short yardage play success rate
-
In season short yardage play success rate allowed by defense
-
Number of converted short yardage plays in the last 11 attempts
-
Number of allowed converted short yardage plays in the last 11 attempts by defense
-
Year scale (percentage of 2pt conversions that year)
-
Play Type (run or pass)
-
Amount of points scored divided by the amount of seconds elapsed in game time
-
Ben Baldwin’s Prediction
These factors were inputted into a GLM in R to perform logistic regression. The model was trained on 2018-2020 data, with an output of whether a two-point try was successful or not.
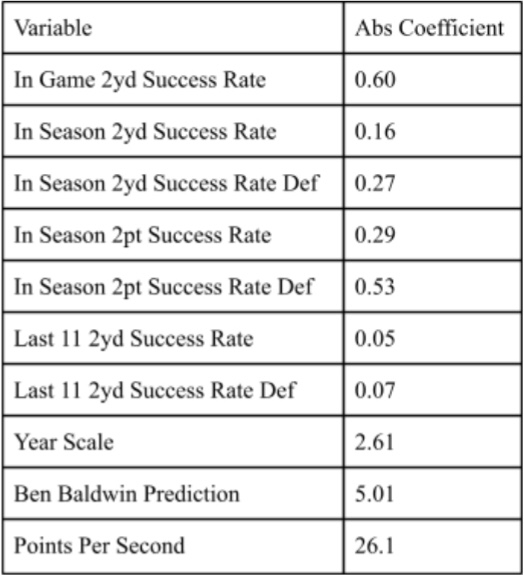
On the right is the absolute coefficient of each factor in the model. It estimates the change in prediction based on a one-unit increase in the predictor variable. These coefficients are not all on the same scale because it is much harder for example to increase your points per second by one than it is to increase your in season two yard success rate by one percent.
The first seven variables listed, however, are on the same scale. We can see that the in-game conversion rate matters the most, most likely because it incorporates how the offense and defense are doing.
We can also see that defensive indicators are generally much stronger than offensive indicators. Two-point conversion success rate is also more important than two-yard success rate and the success rate of the last eleven attempts is less important than the full season.
Results
First, the model was trained. Then, it applied predictions to extra points and two-point conversion attempts during the 2021 NFL season.
The correlation between the model’s predictions and the actual results of two-point attempts was 0.1725. While the number may seem low, two-point conversions are extremely hard to predict. An r-value of 0.1725 is a marked improvement over the previous number of 0.0116. The AUC similarly improved from 0.52 in Ben Baldwin’s model up to 0.5911 in my model. By incorporating success on plays similar to two-point plays, I was able to create a much more accurate two-point model.
With the conversion prediction made, the model can also make recommendations, based on provided win probability numbers, whether to go for two or to kick an extra point.
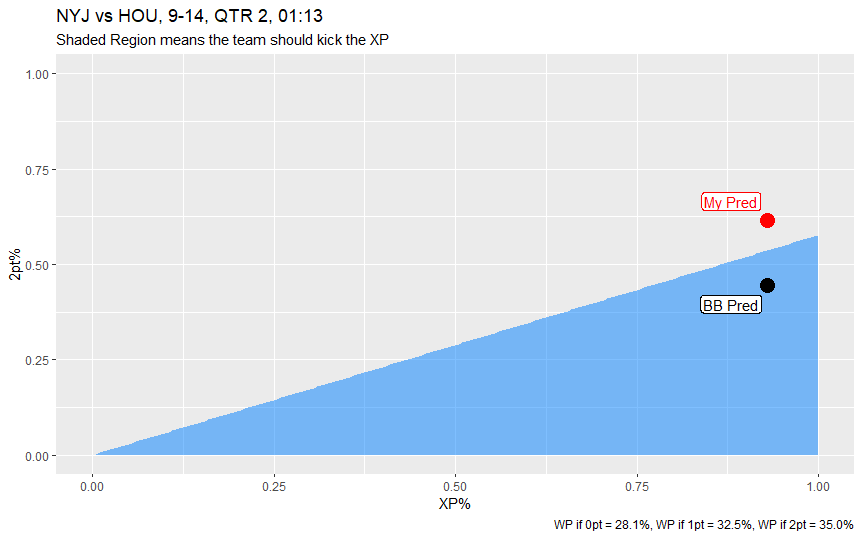
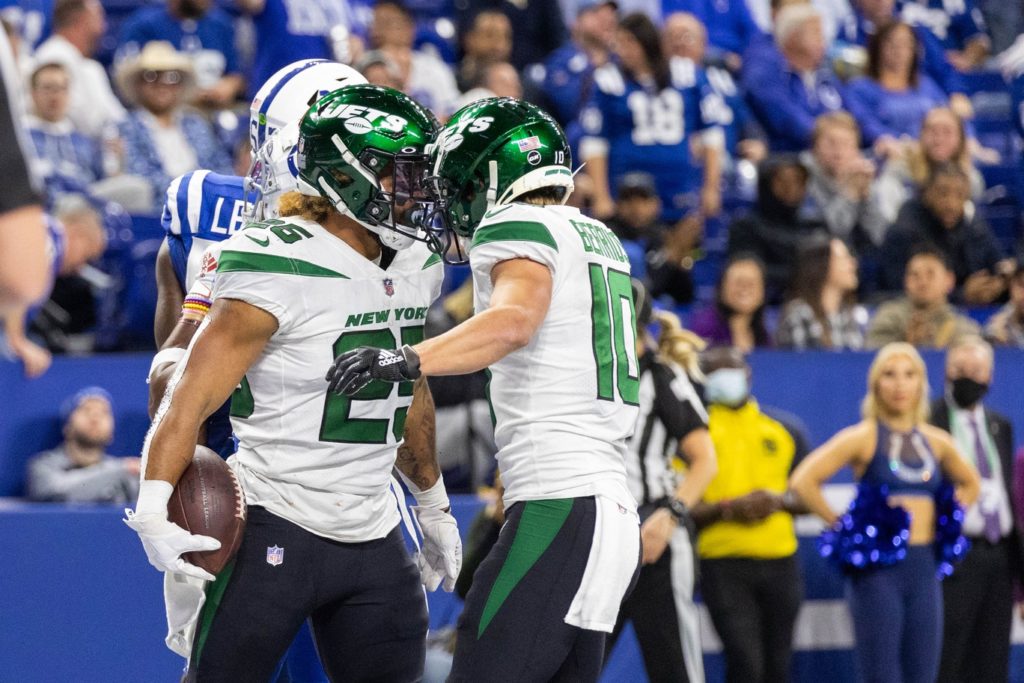
The graphic above shows that my model recommended that the Jets should go for two, while Ben Baldwin’s model suggested that they kick the extra point. The Jets would go on to successfully convert the two-point conversion and ended up winning the game.
A graph such as the one displayed above can make it easier for coaches to think about two-point conversions mathematically.
Coaches can assume an XP% and then check the exact 2pt% needed to get them out of the shaded region. Whether they believe the 2pt% is greater than that value dictates whether they believe their team should go for two.
Another thing that we can do is analyze whether teams go for it when they should. A “strong” prediction by the model can be defined by when the estimated win probability for one decision is greater by at least 1% than the other decision.
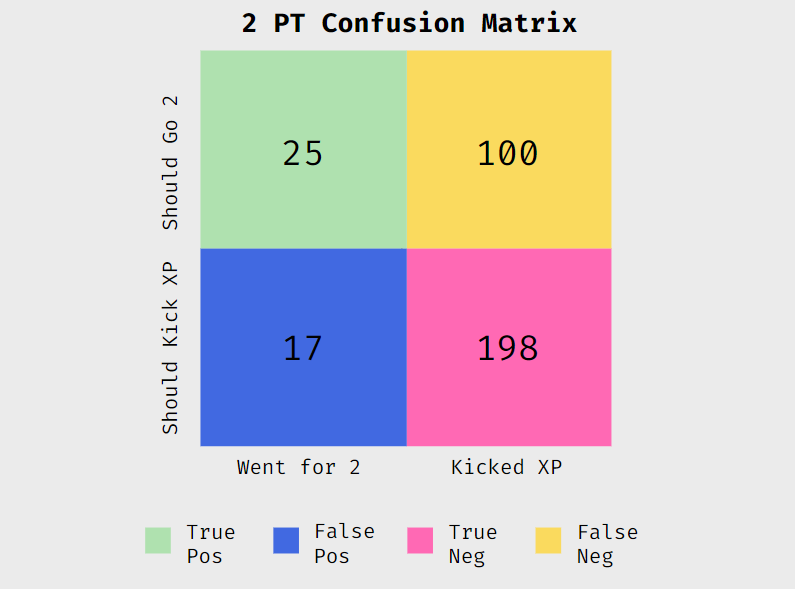
The matrix above displays that when teams went for two it was strongly suggested just 59.5% of the time. Yet, when they kicked an extra point when it was strongly suggested 66.4% of the time. Due to Simpson’s Paradox, if teams listened to the model, there would be 83 more two-point conversion attempts.
Future Steps
My project sets a solid baseline for recommending when to go for two however, it is far from being perfect.
The correlation of the model’s predictions and actual results sits at just 0.1725. The AUC is at 0.5911—two numbers that have a lot of room to grow. By testing other factors such as Drive Success Rate and EPA/Play, the model’s accuracy may increase.
Another thing to note is that some of the win probabilities (particularly for plays involving an extra point) may not be accurate. This is because of a small sample size of teams attempting a two-point conversion early in games. Going forward, it would be best to calculate my own win probabilities to prevent this from happening.
Code: https://github.com/Paranjai-Patil/TwoPointModel
Paranjai Patil contributed to this report.