Welcome to the NFL playoffs recap series! Each week, The 33rd Team's Nic Bodiford will break down the results of the most recent playoff round, offering thoughts for NFL fans, fantasy football players, and sports bettors. For teams that remain in the hunt for the Lombardi trophy, Nic will focus on actionable data for the game(s) to come. For those who have been eliminated, Nic will offer brief thoughts on the implications for 2023 and beyond.
Summary
- Per Ryan Reynolds’ Saturday slate line report, the San Francisco 49ers opened as -10.0-point home favorites versus the Seattle Seahawks and closed at -9.5. They comfortably covered the spread
- The game opened with a 42.5-point over/under and closed at 43.5 points. The game soared past both totals
- Seattle converted six-of-11 third downs and punted on four-of-six fourth downs. The remaining two plays were attempts to go for it. One was successful. The other drew a defensive pass interference call, yielding a first down
- San Francisco converted six-of-13 third downs and punted on two-of-six fourth downs. The remaining four plays were successful field goals
- San Francisco rookie running back Tyrion Davis-Price was inactive
Seahawks
- Seattle quarterback Geno Smith was moderately efficient, averaging 7.23 yards per pass attempt on 35 passes. He produced a 98.9 passer rating
- Smith experienced a renaissance in Weeks 1-13 but suffered an unspecified throwing shoulder injury in Week 14, and his season took a turn for the worse.
- The table below ranks Smith’s passing data in parentheses among NFL quarterbacks with at least 100 pass attempts in Weeks 1-13 and 50 pass attempts in Weeks 14-Wild Card Round. His Wild Card passing data is included for reference.
| Geno Smith Passing Data |
Per Game: Comp.- Pass Att. - Dropbacks |
Comp. Rate |
Yards per Pass Att. |
Per Game: TD - INT |
| Weeks 1-13 |
23.8 - 32.7 - 37.0 |
72.7% |
8.08 |
1.8 - 0.5 |
| Weeks 14-Wild Card |
23.2 - 35.8 - 41.2 |
64.7% |
6.35 |
1.7 - 1.0 |
| Wild Card |
25.0 - 35.0 - 41.0 |
71.4% |
7.23 |
2.0 - 1.0 |
- Tyler Lockett played through finger (surgically repaired in Week 16) and shin injuries this week. While his resulting 22.2% targets per route run rate remained in line with his pre-injury 22.5%, his 1.08 yards per route run were more than a yard less than his pre-injury 2.04
- Now 30 years old, Lockett’s run-after-catch capabilities have significantly decreased, but his crisp route running once again led him to a 1,000-yard season.
- Among 21 NFL wide receivers to record more than 1,000 yards receiving, Lockett was one of just six wide receivers to average fewer than 4.00 yards after catch per reception.
- Teammate DK Metcalf punctuated the season with his best statistical showing, catching 10 passes on 13 targets for 136 yards receiving and two touchdowns
- Among 36 NFL wide receivers with at least three targets in the Wild Card Round, Metcalf’s 36.1% targets per route run rank No. 1, and his 3.78 yards per route run rank No. 2.
- After rarely taking the field in Weeks 1-16, rookie wide receiver Dareke Young averaged seven routes per game during the last three weeks
- During the last two weeks, Young produced a 23.1% targets per route run rate and 2.69 yards per route run, remaining an intriguing 2023 prospect
- Colby Parkinson outplayed fellow tight end Noah Fant during the last three weeks while the latter man nursed a knee injury. Parkinson’s respectable 23.2% targets per route run and 1.41 yards per route run should force Carroll to consider increasing Parkinson’s role in 2023
- Seattle’s backfield was largely held in check. The table below shows Seattle’s inefficient running back results.
| Seattle Seahawks RBs Usage & Production |
Rush Att. - Yards Rushing |
Yards per Rush Att. - Yards After Contact per Rush Att. |
Touchdowns Rushing |
Longest Gain Rushing |
| Kenneth Walker III |
15 - 63 |
4.20 - 1.87 |
1 |
9 |
| DeeJay Dallas |
6 - 13 |
2.17 - 2.33 |
0 |
7 |
San Francisco 49ers
- San Francisco quarterback Brock Purdy became the youngest quarterback in NFL history to throw for 300 yards passing and three touchdowns in a postseason game.
- The table below ranks Purdy’s passing data in parentheses among 12 playoff quarterbacks.
| NFL QB Playoff Passing |
Comp. Rate |
Yards per Pass Att. - Longest Gain Passing |
TD - INT |
NFL Passer Rating |
| Brock Purdy |
60.0% (No. 6) |
11.07 (No. 1) - 74 (No. 1) |
3 (T-No. 3) - 0 (T-No. 1) |
131.5 (No. 2) |
- Purdy took over early in San Francisco’s Week 13 win over the Miami Dolphins after Jimmy Garoppolo suffered a fractured foot. The table below compares Purdy’s inefficient, yet high-upside rushing profile to NFL cornerbacks with at least 50 passing attempts
- Purdy’s green zone rushing does enough to label him a dual threat, despite poor open-field efficiency. His positional rank is shown in parentheses
| NFL QB Rushing |
Per Game: Rush Att. - Yards Rushing |
Yards per Rush Att. - Yards After Contact per Rush Att. |
TDs Rushing per Game |
Green Zone Rush Att. per Game |
| Brock Purdy |
3.00 (T-No. 22) - 3.71 (No. 32) |
1.24 (No. 35) - 0.67 (T-No. 30) |
0.29 (T-No. 9) |
1.00 (T-No. 2) |
- Tight end George Kittle flopped in what should have been a blowup game, due in part to an increase in blocking reps
- Per The 33rd Team’s Edge Tool, Seattle allowed 14.1 yards per reception to opposing tight ends, the highest per-catch yardage rate in the NFL
- The table below compares Kittle’s Wild Card blocking snaps to his Weeks 13-18 averages with Purdy under center
| George Kittle Snaps |
Pass Blocking Snaps per Game |
Run Blocking Snaps per Game |
Routes Run per Game |
| Weeks 1-18 |
2.2 |
23.2 |
28.0 |
| Wild Card Round |
4.0 |
25.0 |
27.0 |
- Among 38 tight ends with at least 10 targets in Weeks 14-18, Kittle was top five in targets (32), receptions (five), yards receiving (293), yards after catch per reception (6.36) and yards per route run (2.33). His seven receiving touchdowns led the position by three
- Kittle finished Saturday with two receptions on two targets for 37 yards receiving
- Wide receiver Deebo Samuel made it through his second consecutive game since returning from a high-ankle sprain and MCL sprain, thriving in his trademark dual-threat role
- The table below ranks Samuel and Brandon Aiyuk’s Wild Card Round receiving data in parentheses among 36 NFL wide receivers with at least three targets.
| NFL WR Wild Card Receiving |
Rec./Tgt. - Yards - TD |
Per Routes Run Rates: Targets - Yards |
aDot - Yards After Catch per Rec. |
Longest Gain Receiving |
| Deebo Samuel |
6/9 - 133 - 1 |
31.0% (No. 5) - 4.59 (No. 1) |
9.56 (No. 20) - 18.50 (No. 1) |
74 (No. 1) |
| Brandon Aiyuk |
3/5 - 73 - 0 |
15.6% (No. 27) - 2.28 (No. 9) |
22.00 (No. 1) - 5.67 (T-No. 7) |
31 (T-No. 10) |
- No. 3 wide receiver Jauan Jennings’ 33-yard long gain ranked top seven, as did both his 31.0% targets per route run and 2.41 yards per route run
- Samuel’s 133 yards receiving trailed only Metcalf (136) and Samuel predictably cooked would-be tacklers in the run game.
- The table below ranks running back Christian McCaffrey’s rushing data among running backs with at least five rush attempts last weekend
| SF Wild Card Rushing |
Rush Att. - Yards - TD |
Yards per Rush Att. - Yards After Contact per Rush Att. |
Longest Gain Rushing |
Green Zone: Snaps - Rush Att. |
| Christian McCaffrey |
15 (T-No. 2) - 119 (No. 1) - 0 (T-No. 6) |
7.93 (No. 1) - 5.93 (No. 1) |
68 (No. 1) |
5 (T-No. 3) - 3 (T-No. 1) |
| Elijah Mitchell |
9 - 2 - 0 |
0.22 - 1.67 |
4 |
3 - 1 |
| Jordan Mason |
2 - 12 - 0 |
6.00 - 4.00 |
8 |
0 - 0 |
| Deebo Samuel |
3 - 32 - 0 |
10.67 - 5.33 |
22 |
4 - 0 |
Summary
- The Jacksonville Jaguars opened as +1.0-point home underdogs to the Los Angeles Chargers and closed at +2.5. Their one-point victory cleared both spreads
- The game opened with a 47.5-point over/under and closed at 46.5 points. The game cleared both totals by the end of the third quarter
- Los Angeles converted eight-of-seventeen third downs and punted on five-of-nine fourth downs. The remaining four downs were field goal attempts, three of which were successful
- Jacksonville converted just two-of-10 third downs and punted on three-of-six fourth downs. Jacksonville converted two-of-three remaining fourth down plays, with the other attempt resulting in an interception
Chargers
- Coach Brandon Staley chose to play his starters in a meaningless Week 18 game resulting in a lower-back injury for receiver Mike Williams, causing him to miss the game
- Though Williams would have helped in the jump-ball department, even when healthy, the pass-catching corps lacks long speed and quarterback Justin Herbert struggled to pick up chunk gains all year.
- Among 47 quarterbacks with at least 100 regular-season pass attempts, Herbert’s 6.42-yard average depth of target ranked 44th and his 20+ air-yard pass attempt rate ranked 42nd.
- This weekend was no different. Herbert’s 5.56-yard average depth of target ranked 11th out of 12 quarterbacks, and his 9.3% 20+ air-yard pass attempt rate ranked seventh.
- Gerald Everett's 109 yards receiving trailed only Minnesota Vikings tight end T.J. Hockenson this weekend. Everett added a touchdown, tallying six receptions on eight targets.
- The box scores of Nos. 2 and 3 tight ends Donald Parham (four receptions on five targets for 23 yards receiving) and Tre’ McKitty (two receptions on two targets for 16 yards receiving) do not jump off the page but their per-route efficiency metrics speak to Jacksonville’s vulnerability.
- The table below ranks the aforementioned tight end’s per-route rates in parentheses among 20 Wild Card Round tight ends.
| LAC TEs - Wild Card Round |
Targets per Route Run |
Yards per Route Run |
| Gerald Everett |
29.6% (No. 8) |
4.04 (No. 2 ) |
| Donald Parham |
31.3% (T-No. 5) |
1.44 (No. 11) |
| Tre’ McKitty |
18.2% (T-No. 12) |
1.45 (No. 10) |
- Kansas City Chiefs tight end Travis Kelce could have a career-best performance against them in the Divisional Round.
- While wide receiver Keenan Allen maintained his elite target-earning ability (27.7% targets per route run), he caught just six-of-thirteen targets for 61 yards and was the only Los Angeles wide receiver to eclipse 35 yards receiving.
- Do-it-all running back Austin Ekeler was unforgivably left out of the passing game, seeing just four targets come his way after averaging 7.5 per game during the regular season. With Williams riding the pine, coach Brandon Staley should have relied on Ekeler’s play-making talent. The 5-foot-10, 200-pound running back earned 127 regular season targets, 19 more than the next closest running back.
- Among 21 NFL running backs with at least 50 regular season targets, Ekeler’s 7.88 yards after catch per reception ranked ninth, yet was just 0.57 average yards under the No. 5 running back, the Cincinnati Bengals’ Samaje Perine.
- Ekeler (13 rush attempts, 35 yards rushing, and two touchdowns rushing) and No. 2 running back Joshua Kelley (seven rush attempts for 20 yards rushing) failed to add much on the ground.
Jaguars
- Quarterback Trevor Lawrence displayed the requisite amnesia needed to be an elite signal caller, going 18-of-23 for 211 yards passing and three touchdowns passing in the second half.
- Lawrence’s brilliance was preceded by a four-interception first half that appeared to show Jacksonville’s writing on the wall.
- Lawrence dialed in his accuracy, completing 78.3% of his third- and fourth-quarter passes after cornerback Asante Samuel Jr. (three interceptions) haunted him for the first 30 minutes of the game.
- Pass catchers Christian Kirk, Zay Jones, and Evan Engram all produced an 80.0% catch rate or better in the second half, combining for 15 receptions, 192 yards receiving, and two touchdowns.
- Each player finished the game with double-digit target totals, making Jacksonville one-of-two Wild Card teams to feature more than one such pass catcher.
- The 5-foot-10, 215-pound running back Travis Etienne stayed hot on the ground while sprinkling some receiving work on top (one catch on one target for 12 yards receiving).
- The table below ranks Etienne’s rushing performance in parentheses among 20 Wild Card running backs with at least five rush attempts.
| Wild Card Round RB Rushing |
Rush Att. - Yards - TD |
Yards per Rush Att. - Yards After Contact per Rush Att. |
Longest Gain Rushing |
Green Zone: Snaps - Rush Att. |
| Travis Etienne |
20 (No. 1) - 109 (No. 2) - 0 (T-No. 6) |
5.45 (No. 4) - 2.90 (No. 5) |
25 (No. 3) |
4 (No. 6) - 1 (T-No. 5) |
- No. 2 running back JaMycal Hasty tallied six total snaps to Etienne’s 63.
Summary
- Per Ryan Reynolds’ Sunday slate Line Report, the Buffalo Bills opened as -11.0-point home favorites against the division-rival Miami Dolphins. They closed as -13.0-point favorites.
- The game opened with a 44.0-point over/under and closed at 43.5. The total cashed by the end of the third quarter.
- Miami converted just four-of-16 third downs and punted on six-of-12 fourth downs. Three of the remaining plays resulted in successful field goals. One resulted in a successful conversion, another yielded a delay of game penalty, and the final attempt failed to convert.
- Buffalo converted nine-of-16 third downs and punted on five-of-seven fourth downs. The other two plays resulted in a successful field goal and a failed conversion.
- Miami inactives included quarterback Tua Tagovailoa, starting left guard Liam Eichenberg, running back Raheem Mostert, and impact cornerback Noah Igbinoghene.
- Buffalo inactives included run-stuffing nose tackle Jordan Phillips, stud safety Micah Hyde, impact cornerback Christian Benford, and wide receiver Isaiah McKenzie.
- Quarterback Skylar Thompson produced playoff worsts in both completion rate (40.0%) and yards per pass attempt (4.89).
- Though Tyreek Hill tallied a Wild Card-high 15 targets, he caught just seven of them for a scoreless 69 yards receiving.
- Hill was the only Miami pass catcher to surpass 45 yards receiving.
- Though Jeff Wilson Jr. had the backfield largely to himself with Mostert out, he tallied just 23 yards rushing on 10 rushing attempts.
Bills
- Quarterback Josh Allen threw for a Wild Card-high 352 yards passing. He added three touchdowns passing and a pair of interceptions.
- Allen totaled 20 yards rushing on four rushing attempts via a bruising 3.75 yards after contact per rush attempt. No Wild Card quarterback, except for Allen, surpassed 3.00.
- Nos. 1 and 2 wide receivers Stefon Diggs and Gabriel Davis led the team with nine targets apiece. Diggs' 114 yards receiving and Davis’ 113 sit No. 3 and No. 4, respectively, among 34 Wild Card wide receivers with at least one target. Davis sprinkled one receiving touchdown on top.
- Every Buffalo wide receiver with at least three targets produced at least one top-half per-route efficiency metric finish. The table below ranks them among 29 Wild Card wide receivers with at least three targets.
| Wild Card WR Receiving |
Targets per Route Run |
Yards per Route Run |
| Stefon Diggs |
22.0% (No. 16) |
2.78 (No. 4) |
| Gabriel Davis |
23.1% (No. 12) |
2.90 (No. 3) |
| Khalil Shakir |
26.3% (No. 9) |
2.41 (No. 5) |
| Cole Beasley |
21.8 (No. 17) |
1.52 (No. 15) |
- Tight end Dawson Knox caught three-of-five targets for 20 yards receiving, and one touchdown.
| Buffalo Bills RB Snaps |
1st & 2nd Down |
3rd & 4th w/ 3+ Yards To Go |
2-Min. Drill |
Red Zone - Green Zone |
| James Cook |
20 |
3 |
0 |
1 - 0 |
| Devin Singletary |
30 |
7 |
12 |
8 - 2 |
| Nyheim Hines |
5 |
4 |
1 |
2 - 0 |
| Buffalo RB Data |
Rush Att. - Yards - TD |
Yards per Rush Att. - Yards After Contact per Rush Att. |
Rec./Tgt. - Yards - TD |
Per Routes Run Rate: Targets - Yards |
| James Cook |
12 - 39 - 1 |
3.25 - 2.17 |
N/A |
N/A |
| Devin Singletary |
10 - 48 - 0 |
4.80 - 4.00 |
N/A |
N/A |
| Nyheim Hines |
N/A |
N/A |
1/2 - 7 - 0 |
28.6% - 1.00 |
- Singletary’s 21 routes run is notably higher than Cook’s nine and Hines’ seven. Singletary’s inability to produce in passing game furthers the confusion over coach Sean McDermott’s passing-attack deployment. Hines is a bonafide passing-down specialist and Cook was billed one prior to Buffalo using an early-second round pick on him last spring.
Summary
- The Minnesota Vikings opened as -3.0-point home favorites over the New York Giants. The spread closed at -3.5.
- The game opened and closed with a sky-high 47.5 over/under. Over bettors were sweating until 7 minutes, 47 seconds left in the fourth quarter, when New York scored the game’s final points.
- New York converted seven-of-13 third downs and punted on two-of-five fourth downs. The remaining three plays resulted in two successful conversions and one successful field goal.
- Minnesota converted just four-of-10 third downs and punted on just three-of-seven fourth downs. Of the remaining four plays, one resulted in a false start followed by a successful field goal. Of the remaining two attempts to convert, one was successful.
- Minnesota perimeter cornerback Cameron Dantzler was inactive.
Giants
- Quarterback Daniel Jones demolished Minnesota. The table below ranks both his passing and rushing production in parentheses among 10 Wild Card Round quarterbacks.
| Wild Card QB Passing |
Comp. Rate |
Yards Passing - Yards per Pass Att. |
TD - INT |
Rush Att. - Yards - TD |
| Daniel Jones |
68.6% (No. 5) |
301 (No. 5) - 8.60 (No. 4) |
2 (T-No. 5) - 0 (T-No. 1) |
17 (No. 1) - 78 (No. 1) - 0 (T-No. 5) |
- New York’s perimeter passing game ran roughshod over Minnesota’s cornerbacks. Wide receiver Isaiah Hodgins posted a career-high 105 yards receiving and tied his single-game reception best with eight catches. He is one of 11 wide receivers to score a touchdown in the 2022 Wild Card Round. His reception and yards receiving totals are both top-five at the position.
- Though fellow wide receiver Darius Slayton had a near-costly drop, his 22.00 yards receiving per reception (four catches on eight targets for 88 yards receiving) was third-best at the position.
- Hodgins (2.39, No. 7) and Slayton (2.10, No. 11) posted wonderfully efficient yards per route run rates.
- Slot receiver Richie James Jr. flopped (four receptions on six targets for 31 yards receiving) in what should have been a blow-up spot versus the dreadful slot cover man Chandon Sullivan.
- Active in 12 games, rookie tight end Daniel Bellinger posted his eighth 100.0% catch-rate outing.
- Running back Saquon Barkley’s passing game involvement has fluctuated this year but over his last four games, the 6-foot, 232-pound burner has averaged 5.0 receptions on 7.0 targets, and 33.3 yards receiving.
- Barkley’s 5.89 yards per rush ranked No. 2 among Wild Card running backs with at least five rush attempts.
- Matt Breida took 21 snaps to Barkley’s 61.
Vikings
- Quarterback Kirk Cousins completed Wild-Card high 79.5% of passes but remained buoyed close to his season-long per-game averages with 273 yards passing and two touchdowns passing.
- Cousins punched in a one-yard rushing touchdown but failed to hit the over on his 1.5-yard rushing prop after another one-yard quarterback sneak was called back.
- Tight end T.J. Hockenson unleashed fury upon New York’s linebackers, leading Wild Card tight ends in targets (11), receptions (10), and yards receiving (129). The table below ranks his receiving production in parentheses among Wild Card tight ends.
| Wild Card TE Receiving |
Per Routes Run Rates: Targets - Yards |
aDot - Yards After Catch per Rec. |
Longest Gain Receiving |
| T.J. Hockenson |
35.5% (No. 3) - 4.16 (No. 1) |
6.64 (No. 10) - 6.50 (No. 10) |
28 (No. 3) |
- Notably, No. 2 tight end Irv Smith Jr. finished No. 1 in targets per route run (66.7%, three routes) while No. 3 tight end Johnny Mundt finished No. 7 in yards per route run (1.71). Philadelphia Eagles tight end Dallas Goedert is licking his chops at the prospect of facing New York in the Divisional Round next weekend.
- Wide receiver Adam Thielen (three catches on four targets) was the only remaining Minnesota pass catcher to produce 50 yards receiving or more, though Justin Jefferson did secure seven-of-nine targets.
- Running back Dalvin Cook was limited to 70 yards from scrimmage via 15 rush attempts and a surprising seven targets.
Summary
- The Cincinnati Bengals opened as -6.5-point home favorites over the Baltimore Ravens. The spread closed at -8.5.
- The total opened at 43.5 points and closed at 42.5. The under held true as the game finished at 41 points.
- Baltimore converted an embarrassing three-of-11 on third downs and punted on three-of-seven fourth downs. Baltimore converted two-of-three fourth-down conversion attempts. The final fourth down yielded a successful field goal.
- Cincinnati converted seven-of-13 third downs and punted on five-of-six fourth downs. The remaining play yielded a successful field goal.
- Baltimore’s inactives included quarterback Lamar Jackson, running back Kenyan Drake, and cornerback Brandon Stephens.
- Cincinnati’s inactives included starting right guard Alex Cappa and backup running back Chris Evans.
Ravens
- Backup quarterback Tyler Huntley completed just 58.6% of passes and punctuated the day with a lost rushing fumble.
- While Pro Bowl tight end Mark Andrews posted a respectable five receptions on ten targets for 73 yards receiving, he was the only Baltimore pass catcher to record 50 yards receiving or better.
- Andrews was one-of-three tight ends to hit double-digit targets and finished No. 5 in both targets per route run (31.3%) and yards per route run (2.28).
- Wide receiver Demarcus Robinson cleared 2.00 yards per route run (2.33) for just the fourth time this year.
- The much-ballyhooed preseason star Isaiah Likely flubbed his way to a zero-target outing. His rookie-year 21.4% targets per route run rate shows extreme promise, ranking seventh among 29 tight ends with at least 50 targets. His 17th-ranked 1.33 yards per route run shakes the confidence though.
- Running back J.K. Dobbins finished on a high note, producing top-seven Wild-Card rates in both yards per rush attempt (4.77) and yards after contact per rush attempt (2.69).
- Dobbins surprisingly showed up in the passing game, finishing top-four in targets (five), receptions (four), and yards receiving (43). He was one of just three running backs to tack on a touchdown receiving.
Bengals
- Quarterback Joe Burrow had a quiet and efficient outing, completing 71.9% of pass attempts for 209 yards passing and one touchdown. He added five rush attempts for nine yards and one touchdown on the ground.
- Superstar wide receiver Ja’Marr Chase hogged targets, securing nine-of-12 for 84 yards and one touchdown.
- Among Wild Card wide receivers with at least three targets, Chase’s 31.6% targets per route run ranked third and his 2.21 yards per route run ranked 10th.
- Both wide receiver Tee Higgins (37 yards receiving) and tight end Hayden Hurst (45 yards receiving) caught four-of-six targets while slot receiving Tyler Boyd (three receptions on three targets for 26 yards) predictably struggled against slot defensive back Kyle Hamilton.
- Coach Zac Taylor is employing a clear-cut one-two punch at running back. Joe Mixon handles the rushing- and scoring-position work while Samaje Perine operates as the passing-down specialist.
| Cincinnati Bengals Snap |
1st & 2nd Down |
3rd & 4th Down w/ 3+ Yards To Go |
2-Min. Drill |
Red Zone - Green Zone |
| Joe Mixon |
24 |
0 |
1 |
4 - 1 |
| Samaje Perine |
16 |
10 |
1 |
1 - 1 |
| Cincinnati Bengals RB Production |
Rush Att. - Yards - TD |
Yards per Rush Att. - Yards After Contact per Rush Att. |
Rec./Tgt. - Yards - TD |
Per Routes Run Rates: Targets - Yards |
| Joe Mixon |
11 - 39 - 0 |
3.55 - 1.73 |
3/4 - 17 - 0 |
40.0% - 1.70 |
| Samaje Perine |
2 - 3 - 0 |
1.50 - 2.50 |
0/1 - 0 - 0 |
5.0% - 0.00 |
Summary
- Per Ryan Reynolds’ Monday Night Football Line Report, the Tampa Bay Buccaneers opened as +3.0-point home underdogs versus the Dallas Cowboys. They closed as +2.5-point underdogs.
- The game total opened with a 45.0-point over/under and closed at 45.5 points. Thanks to disastrous offensive play from Tampa Bay and Dallas kicker Brett Maher’s inability to knock through extra points, the under safely cashed.
- Dallas converted seven-of-13 third downs and punted on four-of-six fourth downs. The remaining two plays were both converted for touchdowns.
- Tampa Bay converted 10-of-17 third downs and punted on five-of-seven fourth downs. Tampa Bay converted one-of-two remaining fourth-down attempts.
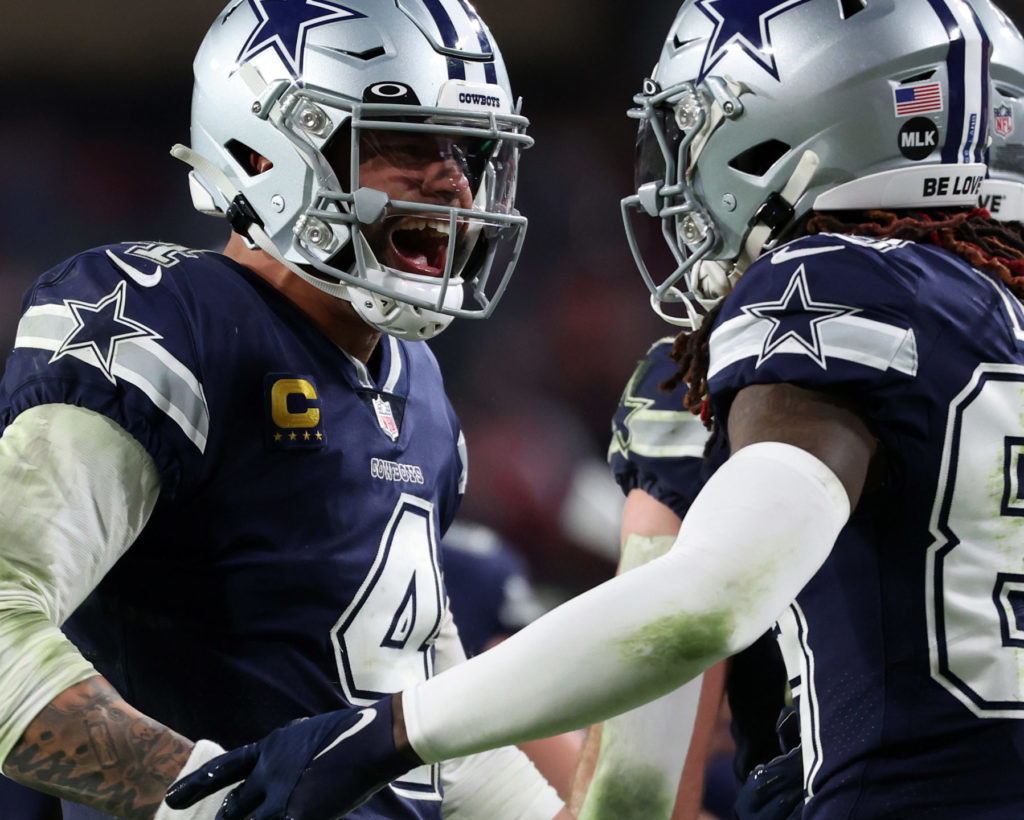
Cowboys
- Quarterback Dak Prescott was surgical in his dismantling of the Tampa Bay defense. The table below ranks his exceptional passing stats in parentheses among 12 Wild Card quarterbacks.
| Wild Card QB Passing |
Comp. Rate |
Yards Passing - Yards per Pass Att. |
TD - INT |
NFL Passer Rating |
| Dak Prescott |
75.8% (No. 2) |
305 (No. 4) - 9.24 (No. 2) |
4 (T-No. 1) - 0 (T-No. 1) |
143.3 (No. 1) |
- Prescott added seven rush attempts for 24 yards rushing and was one-of-four quarterbacks to nab a touchdown rushing.
- It was Prescott’s best all-around effort of the year, marking the second occasion in which he’d thrown for more than 300 yards passing and his only such four-touchdowns passing game.
- Tight end Dalton Schultz stole the show with his single-game career-best 95-yard receiving line, catching seven-of-eight targets while scoring two touchdowns.
- Schultz took the No. 4 Wild Card tight end spot in yards per route run with a smoking 2.71.
- Notably, fourth-round rookie Jake Ferguson is now up to a 20.5% targets per route run rate and a 1.86 yards per route run rate. Both numbers tease untapped talent. Dallas fans should look forward to Ferguson taking on a larger receiving role in 2023. Do not be surprised if Ferguson makes consequential plays before then though.
- Wide receiver CeeDee Lamb (four receptions on six targets for 68 yards receiving and one touchdown receiving), a star in the making, sealed the game with this catch-and-waltz touchdown with 10 minutes left in the fourth quarter:
- No. 2 wide receiver Michael Gallup is still shaking cobwebs off his surgically reconstructed ACL but his Wild Card touchdown added flair to his otherwise pedestrian five-catch, six-target, 46-yards-receiving outing.
- Gallup’s 1.48 yards per route run rank 17th among Wild Card wide receivers with at least three targets.
- In-season signee T.Y. Hilton continues to bring the downfield juice that Gallup attempted to generate.
- Though Hilton has just once surpassed two receptions in four games, his 17.50-yard average depth of target paces Dallas’ starters by more than six yards, suddenly keeping safeties honest.
- Coach Mike McCarthy has turned over nearly all lead back duties to former No. 2 running back Tony Pollard, though Ezekiel Elliott maintained a slight edge in scoring position.
| Dallas Cowboys RB Snaps |
1st & 2nd Down |
3rd & 4th Down w/ 3+ Yards To Go |
2-Min. Drill |
Red Zone - Green Zone |
| Tony Pollard |
31 |
7 |
6 |
7 - 3 |
| Ezekiel Elliott |
27 |
3 |
5 |
4 - 4 |
| Dallas Cowboys RB Usage & Production |
Rush Att. - Yards Rushing |
Yards per Rush Att. - Yards After Contact per Rush Att. |
rec./Tgt. - Yards - TD |
Per Routes Run Rates: Targets - Yards |
| Tony Pollard |
15 - 77 - 0 |
5.13 - 3.40 |
3/3 - 12 - 0 |
18.8% - 0.75 |
| Ezekiel Elliott |
13 - 27 - 0 |
2.08 - 2.69 |
1/2 - 9 - 0 |
15.4% - 0.69 |
- Among 20 running backs with at least five Wild Card rush attempts, Pollard’s 5.13 yards per rush attempt and 3.40 yards after contact per rush attempt both rank top five.
Buccaneers
- Quarterback Tom Brady managed to finish a yard under Buffalo’s Josh Allen in the yardage column (351-to-352), his 53.0% completion rate beat out only Miami’s Skylar Thompson.
- Brady added a pair of touchdowns passing and one interception in a whimper of a performance.
- Safety-blanket slot receiver Chris Godwin paced the team with 13 targets but Tampa Bay was one-of-two teams to feature more than one pass catcher with double-digit targets, including Mike Evans and Julio Jones.
- The three men gave their all against Dallas’ star-laced defense. The table below ranks their receiving data among 36 Wild Card wide receivers with at least three targets.
| Wild Card WR Receiving |
Rec./Tgt. - Yards - TD |
Per Routes Run Rates: Targets - Yards |
aDot - Yards After Catch per Rec. |
Longest Gain Receiving |
| Chris Godwin |
10 (T-No. 1)/13 (T-No. 3) - 85 (No. 7) - 1 (T-No. 2) |
22.0% (No. 15) - 1.44 (No. 19) |
3.31 (No. 35) - 5.30 (No. 9) |
16 (No. 24) |
| Mike Evans |
6 (T-No. 11)/11 (T-No. 8) - 74 (T-No. 10) - 0 (T-No. 15) |
17.7% (No. 23) - 1.19 (No. 24) |
13.18 (No. 10) - 2.83 (No. 21) |
20 (No. 19) |
| Julio Jones |
7 (T-No. 7)/11 (T-No. 8) - 74 (T-No. 10) - 0 (T-No. 15) |
31.4% (No. 4) - 2.11 (No. 11) |
6.55 (No. 28) - 2.43 (No. 26) |
30 (No. 12) |
- Wide receiver Russell Gage was carted from the field with head and neck injuries. A Tuesday morning statement from the team indicates Gage has mobility in his extremities.
- Fourth-round rookie tight end Cade Otton successfully stole the No. 1 tight end job from veteran Cameron Brate but Otton’s dreadful 14.2% targets per route run and 0.88 yards per route run offer little enthusiasm for 2023 and beyond.
- Despite pre-game reports that the team was planning to unleash veteran running back Leonard Fournette, round-three rookie Rachaad White was the clear-cut lead back in all facets of the game.
| Tamba Bay RB Snaps |
1st & 2nd Down |
3rd & 4th Down w/ 3+ Yards To Go |
2-Min. Drill |
Red Zone - Green Zone |
| Rachaad White |
32 |
9 |
5 |
8 - 3 |
| Leonard Fournette |
26 |
8 |
6 |
4 - 2 |
| Tampa Bay RB Usage & Production |
Rush Att. - Yards - TD |
Yards per Rush Att. - Yards After Contact per Rush Att. |
Rec./Tgt. - Yards - TD |
Per Routes Run Rates: Targets - Yards |
| Rachaad White |
7 - 41 - 0 |
5.86 - 3.43 |
4/6 - 36 - 0 |
17.6% - 1.06 |
| Leonard Fournette |
5 - 11 - 0 |
2.20 - 1.80 |
1/1 - 6 - 0 |
3.7% - 0.22 |
Nic Bodiford contributes to The 33rd Team's fantasy football department and works elsewhere as an analyst and editor in written, video and audio mediums. These works can be found at Pro Football Focus, 4for4, Nerdball and Fake Teams. Nic moonlights at Legendary Upside by editing Pat Kerrane's weekly article, The Walkthrough.