Breakdowns
6/20/22
9 min read
Study: The Impact of Close Games on Every Team's Record in 2021

If you ask any Ravens fan what it was like watching the team play week-in and week-out in 2021, they’ll tell you how many years were taken off their life. In that season alone, the Ravens played 11 games that were either decided by three points or less or overtime, which is the most out of the 320 team seasons in the past 10 years and is 2.5 times more than average (25% since 2012; around 4 games per season). The Ravens’ first half of 2021 was promising with an 8-3 start. They managed to go 5-1 in games that were decided by 3-points or less, or overtime. The luck they had early on reversed itself for the remainder of the season as the Ravens lost six in a row – five of them lost by a combined eight points. The biggest factor, of course, was Lamar Jackson injuring his ankle in game thirteen and missing the rest of the season. However, those five close losses could have gone either way, but their good fortune ran out.
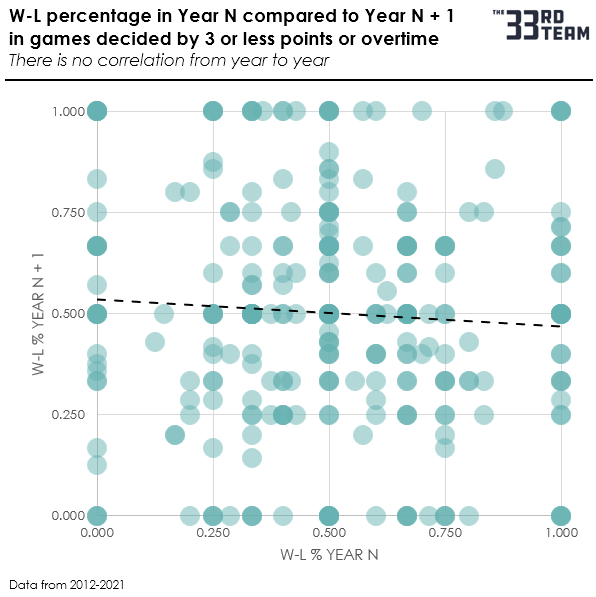
These close games are generally a toss-up; coming out on the winning end or losing end is more often a toss-up. This is not to say that there aren’t some players or coaches who may perform better or worse in these situations, but, on aggregate, the results are random, which we can see when we plot teams’ winning percentages in these types of games over the past 10 years. The chart below plots winning percentage in 3-point differential or overtime games in Year N on the horizontal axis and in year N+1 on the vertical axis. There is no predictive pattern from one year to the next, which suggests complete randomness in these games.
While the volume of close games was extraordinary for the Ravens, the fact their winning percentage in close games compared to their winning percentage in games decided by greater than three points was similar suggests that the Ravens weren’t really hurt or helped by their performance in close games (the fans, however, could argue the negative impact on their well-being). What’s more interesting is understanding which teams were impacted the most from their record in close games.
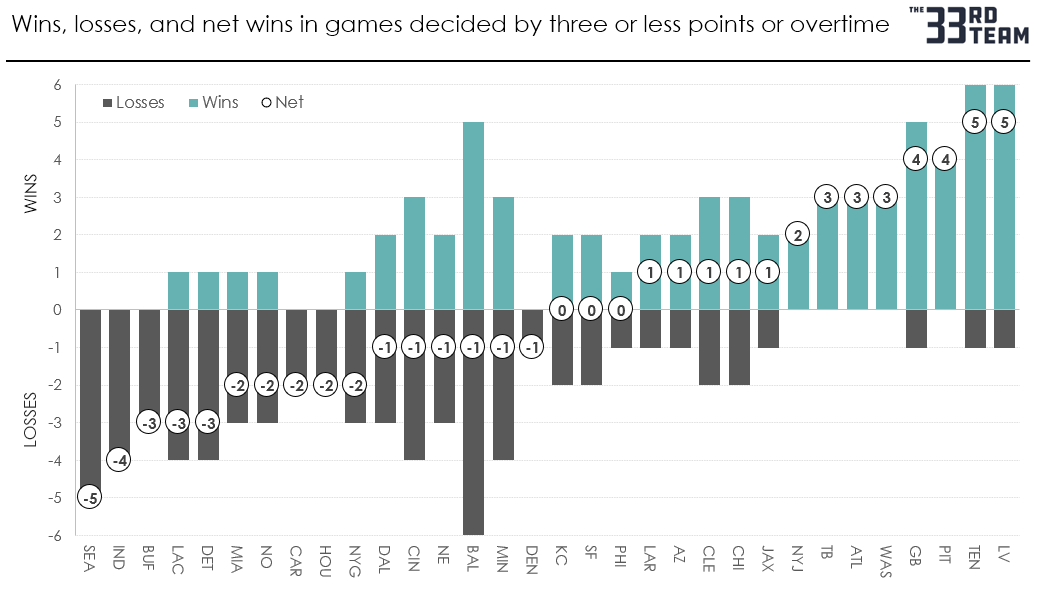
Part of the math is looking at wins (or net losses) from 3-point games. This chart shows the impact from close games combining wins and losses, sorted by the net result. Seattle, at the far left, lost five games decided by three points or less (or OT), and won zero, for a net of -5. The other end of the spectrum shows Las Vegas and Tennessee both having a 6-1 record in close games for a net of +5.
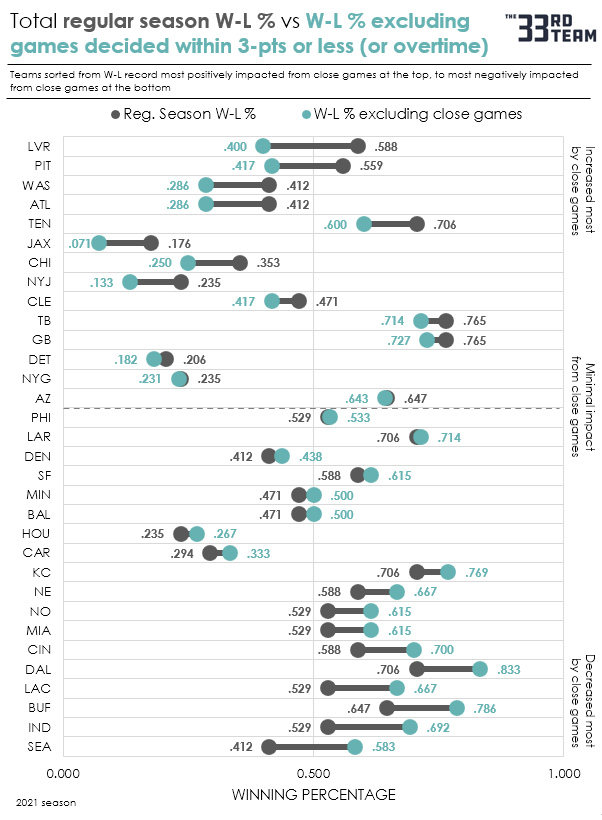
Once we have the W-L data segmented by close games, as shown above, it’s useful to compare that to their record outside of these close games. If a team has a .750 winning percentage outside of close games and a .750 winning percentage in close games, we can surmise that they weren’t helped or hurt by their record in close games. For example, a team with a .500 winning percentage outside of close games (6-6) and a .800 winning percentage in close games (4-1) ends up with a 10-7 record and a .588 winning percentage. The assumption in this example can be that their winning percentage was .088 higher because of their record in close games. (Total W-L % of .588) – (W-L % outside of close games of .500) = +.088.
Which teams in 2021 benefited the most from their close game record relative to their overall record?
When the Las Vegas Raiders weren’t winning coin-flip games at a high rate (6-1), they were losing more than they were winning. They ended up 10-7, but they were only 4-6 in non-toss-up games. The 10-7 Raiders were immediately eliminated in the playoffs when they faced the 10-7 Bengals. However, the 10-7 Bengals record was much less of a mirage as they went 7-3 on non-toss-up games. The Raiders +.188 close game impact on their winning percentage was the highest in the NFL in 2021 and the third highest within the last 10 years.
The Steelers, who made the playoffs in 2021 were also aided by pulling out close wins at a high rate. They never lost in their five toss-up games going 4-0-1, which helped protect their otherwise losing record just enough to make the playoffs with a 9-7-1 record, and then immediately lose to the Chiefs 42-21 in the Wild Card round. Given their record outside of close games (5-7), the Steelers probably weren’t a playoff team in terms of talent.
Atlanta and Washington were next on the list with a significant bump in their record from going 3-0 in close games. But because they weren’t playoff teams, the added .126 on their overall WP was inconsequential.
Tennessee is another playoff team with a lot of help from their record in close games, and like Pittsburgh and Las Vegas, their inflated record which gave them the No. 1 seed in the AFC, didn’t translate to their performance in the playoffs. They were also one-and-done losing their first game in the Divisional Round at home to the Bengals who had a worse record on paper but had a higher winning percentage in games that were decided by more than three points.
Which teams in 2021 were hurt the most from their close game record relative to their overall record?
Seattle ended up missing the playoffs with a 7-10 record. However, their winning percentage outside of close games was .583 — better than three of the playoff teams in 2021. Their 0-5 record in 3-pt or OT games impacted their overall winning percentage by -.171. The -.171 impact is not only the largest negative impact in 2021, but it also is the worst out of 320 team seasons in the 10-year history in our data set.
At 9-8, Indianapolis missed the playoffs by just one win. If they were able to go just 1-3 instead of 0-4 in close games, they would have been in the playoffs. Their winning percentage in games outside of 3-point games was better than half of the playoff teams in 2021 for similar games. When Indy won, their average win was by sixteen points, but half of their losses were either in overtime or by three or fewer points.
With 50% of their losses coming from close games and none of their wins coming from close games, Buffalo was negatively impacted by their 0-3 record in close games. Playing in only three close games is below average. They were dominant enough in the other games that the negative impact endured wasn’t enough to keep them out of the playoffs, as they won the Wild Card over New England by thirty and then lost in OT in the Divisional round to Kansas City.
Like Indianapolis, the Los Angeles Chargers only needed one more win to make the playoffs, and their hard-luck record in overtime or three-point games kept them out. In their twelve games decided by more than three points, their .667 winning percentage was equal to or better than half of the playoff teams in 2021. Only going 1-4 in close games pulled their overall WP down by .138.
The teams at the top of the next chart had the most help from their record in close games while teams at the bottom were hurt the most from their record in close games. The teal dot is the winning percentage outside of close games. The gray dot is the overall winning percentage. The difference between the two is the impact from three point and overtime games.
Why is any of this important? It can be assumed, excluding some outlier players or coaches, that winning close games is mostly luck. This is evident in the first chart where we see no stickiness in this metric from year to year. Given that it’s mostly luck, we can determine which teams’ records are mirages (good or bad), which may help us better estimate a team’s chances of going to the playoffs or understand why a team may have over-performed or underperformed in the playoffs. This can be illustrated using an example from 2021. By comparing the three playoff teams who were positively impacted from their record in close games by at least +.100 to the teams that were negatively impacted with a minimum of -.100, it’s important to note the results, even if it’s only an example from one year.
The playoff teams who were most helped by their record in close games (TEN, PIT, LVR) won an average of 10.5 games overall in 2021 with more than half of their wins (5.5) coming from games decided by three points or fewer or OT. They won only 47% of their games outside of close games and their inflated record may have masked their weaknesses as they went 0-3 in the playoffs.
The playoff teams who were most hurt by their record in close games (BUF, DAL, CIN) won an average of 11.0 games overall in 2021 with more than half of their losses (3.3) coming from games decided by 3 points or fewer or OT. They won 78% of their games outside of close games and their overall record may have been an underestimation of their ability, as they went 4-3 in the playoffs.
Both groups ended the season with similar overall winning percentages (.618 for the first group and .647 for the second group) with only a half of a win difference between them. Ultimately, they ended up with vastly different playoff results which may have been an indication of their true strength that was masked by good or bad luck in close games.
With 25% of a team’s season being decided by games that are a virtual toss-up, teams will often be eliminated from playoff participation by a lesser capable team simply because of significant swings in their record in close games. Teams like Tennessee can be elevated to the best record in the conference because of a 6-1 record in these close games and get a playoff bye with home field advantage only to lose immediately as they play more like their record in non-toss-up games. This analysis does a better job understanding a team’s true ability compared to their record in-season but is not as good of a predictor as positive or negative regression year-over-year, since there are too many other factors at play in year-over-year regression. As we go into the 2022 season and we begin to notice the teams that are experiencing good or bad luck in close games, it will help to segment their records to truly gauge their potential and understand which teams’ records are more of an illusion than reality.


