Analysis
10/24/20
4 min read
Ranking NFL Kickers By FG Percentage Over Expectation
When a kicker lines up for a field goal, what are the chances he makes the kick? It is common knowledge that field goals from farther away are more difficult to make than those from up close. To quantify this change in difficulty by distance, the expected field goal percentage from each distance can be found. This expected field goal percentage takes into account every field goal attempt from the last five NFL seasons and finds the percentage made from each kick distance. The results of these percentages can be seen in the graph below:
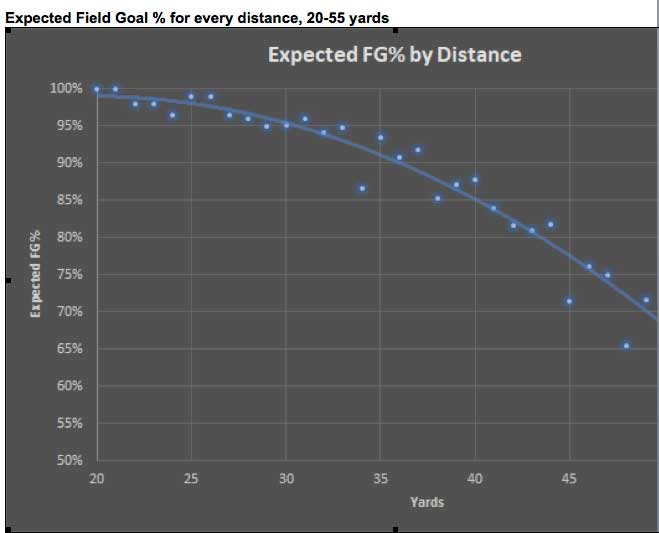
To have an appropriate sample size for these percentages, only field goals between 20 and 55 yards were used. As can be seen, there is some significant fluctuation in the percentages, even within a few yards. To minimize these fluctuations, a trend line was used which accounted for 95% of the variation in the percentages. This trend line was then used as the Expected Field Goal Percentage (EFG%) for each distance.
Finding Over Expectation
Once the EFG% was found for each distance, it can be applied to find the overall expected field goal percentage for each NFL kicker. For each kicker, the EFG% of each kick attempted over the past five seasons was averaged, to find the kicker’s average EFG%. This method would lower the expected percentage for kickers who attempted kicks from farther away, while increasing expectations for easier kicks. The kicker’s EFG% was then compared to their actual FG% over the same period to find their Field Goal Percentage Over Expected (FG% OE).
Narrowing down the kickers to those who have attempted 50 or more field goals in the past five seasons left 37 eligible kickers. The top 10 by FG% OE are in the table below:
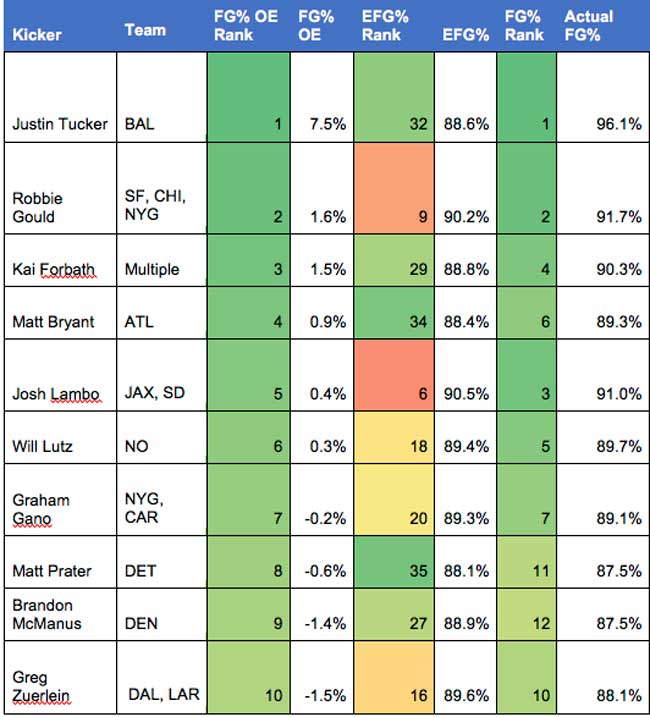
The top kicker on this list is unsurprisingly Baltimore’s Justin Tucker. Tucker ranks first in actual field goal percentage and has some of the most difficult attempts of all qualifying kickers, resulting in an expected field goal percentage that ranks 32 out of 37. He has been selected as a first-team All-Pro four times over his NFL career, including last season, and shows no signs of slowing down.
There is a big drop-off to the second player on the list, Niners kicker Robbie Gould. Gould only has one first-team All-Pro selection, back in 2006, likely because he does not regularly attempt the most difficult field goals. He ranked ninth on the list in expected field goal percentage, indicating a higher rate of shorter kicks, but his overall FG% (second) was enough to buoy his ranking.
Jags kicker Josh Lambo is in a similar situation, with a high EFG% despite ranking third in actual FG%. This method discounts easier kicks, and Lambo is one who feels the consequences.
Last on the list is Cowboys kicker Greg Zuerlein. Zuerlein is known for his leg strength and has hit a 61-yard field goal in his career. Since this study only looks at kicks up to 55 yards, it does not factor in these extremely long-range kicks, but it is good to see this Pro Bowl kicker making it onto the list.
Final Thoughts
Field Goal Percentage Over Expected is a good measurement of a kicker’s effectiveness because it compares his performance to those of other NFL kickers in similar situations. Unfortunately, the sample size constraint does not allow kickers with abnormally long range, such as Zuerlein, to benefit as much. In future studies, it would be interesting to factor in live weather data, such as wind speed at the time of the kick, to improve the model. While all field goals are worth the same amount of points, some are certainly more difficult to make than others.