Breakdowns
12/10/21
5 min read
Don't Be Afraid Of Analytics
As a term, analytics has become a sort of lightning rod. It is the enemy of some who actively like seeing it proven wrong. In most cases though, this reaction stems from a mischaracterization and lack of understanding about what it is.
Hearing the word should not cause blood pressure to rise, nor should it be scary at all. Analytics dates back at least 50 years in the NFL and perhaps even longer. But the more digestible way to understand it, especially for coaches, is in terms of Quality Control. So, what does a Quality Control Coach do?
Quality Control Coaches
During the season, their job is to provide the Head Coach all the factual information he needs about the opponent and his own team. In turn, this is intended to give the Head Coach the best chance to call the right plays in the right situations.
Let’s break that down a little further. Suppose you have the ball and it’s 3rd and 6 on the 50 yard line. In this situation, it’s the quality control coach relaying what defense the opposing team is most likely to be in, along with the second most likely defense. The Offensive Coordinator is then using that projection and probability to influence what play he calls. That’s obviously smart.
Now, what’s happened is we have developed the ability to widen the information, creating increasingly complex analysis that factors in additional criteria. For some reason, strong disagreement persists about utilizing this information. Yet, this is exactly what coaches have desperately wanted from their quality control coaches for years. I don’t know a coach in the league that would want to go into a game and not have that information.
Playing the Odds
Here’s another example: it’s fourth down on the opponent’s four yard line. You have to decide whether to go for it or kick the field goal. In this case, you’d surely like to know the following: what is the likelihood of scoring a touchdown? What play gives you the best chance to score? What defense is the opponent most likely to play? Most importantly, if you fail to score, what is likely to happen next?
The odds might be that if you don’t convert, the other team is likely to go three-and-out or get one first down then punt. This would put you in a situation where you would still likely come away with the same three points you’d get if you kicked the field goal initially. In other words, you get a free chance at scoring seven (instead of three) because the odds are high that your defense will stop them reasonably quickly if you don’t score the touchdown.
The key, however, is that this is simply an example of playing the odds. Games will not always follow the most likely outcome. You may get stopped, and the other team may drive the length of the field and score. While this is not the probable result, by no means does it rule out the possibility of it occurring. In fact, it is directly built into the odds.
Analytics is a Guideline
Analytics should be understood as a guideline to help make decisions in conditions of uncertainty. All that entails is providing information to coaches or player personnel people that history says increases the odds of making correct decisions. It doesn’t tell them what to do. It doesn’t make any absolute rules. It doesn’t guarantee success. It just increases the odds of being right.
While decisions should be using it more often than not, it shouldn’t be used all the time. But it’s already denoting that through probability. It’s a coach’s job to understand the circumstances and determine if it makes sense to play the odds. Sometimes the numbers may indicate to go for a fourth down, but the coach will punt because he knows they don’t have the right play. Nobody should be so dogmatic that they think the analysis is absolute and the coach shouldn't be able to override it.
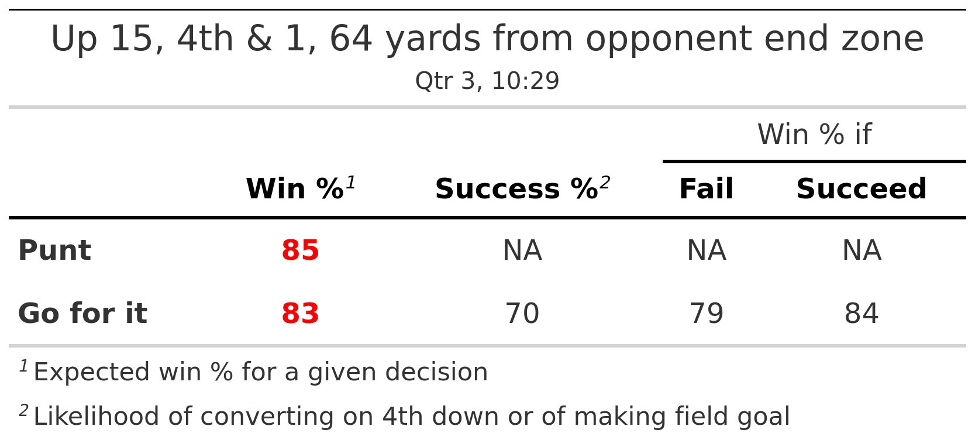
Coaches also shouldn’t be overly aggressive on fourth down, which is something that occurred in the Big 12 Championship. Baylor decided to go for it on fourth and one on their own 36 while up 15 points. They didn’t convert, and if it weren’t for an incredible goal line stand at the end of regulation, it could have cost them a conference championship.
The chart below displays a fourth-down model that says Baylor decreased their win probability by approximately 2% when they decided to go for it. The odds don’t always say to go for it on fourth down, even in short yardage situations. Regardless of whether Baylor had different numbers, coaches need to exercise appropriate judgment.
Though the information is a little bit more sophisticated, there is nothing to be scared of with the term “analytics.” It’s just a continuation of what’s been done forever. It’s a guideline, providing good information to increase the chances of making correct decisions. It may seem complex, but it’s really that simple.