Breakdowns
4/21/21
6 min read
Athletic Success Indicator: Using Combine Data to Predict NFL Success
The NFL Combine is one of the biggest events in the lead-up to the draft. Scouts weigh, measure and time prospects in a variety of drills. The fastest 40-yard dash times often make headlines, but how important are these results? Are good performances in some areas more important than others? Can these results be used to quantify a player’s chances of success in the NFL? An analytics-based approach can supply answers to these questions and more.
The Athletic Success Indicator (ASI) attempts to quantify a player’s likelihood of success in the NFL based on the testing numbers at the NFL Combine or the player’s pro day. Many metrics, such as the Relative Athletic Score (RAS), simply look at if the player’s testing numbers were higher or lower than others at their positions and find the player’s percentile performance. ASI, on the other hand, weighs performance in different events differently based on the player’s position, attempting to quantify the importance of each.
The theory behind this structure is that different metrics are more predictive of NFL success for some positions over others. For example, the bench press may be more important for an offensive lineman than for a defensive back. Thus, players categorized at different positions are evaluated differently and compared to past players at their position to find their likelihood of NFL success.
Quantifying Success
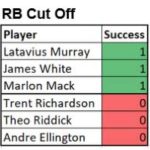 Success in the NFL was determined by looking at a player’s Approximate Value (AV) over the first four seasons of their career. AV is a metric from pro-football-reference that puts a number value on a player’s performance each season. The first four years were used because that is the value a player produces over the length of his rookie contract. A cutoff was made around the 70th percentile at each position, with slight adjustments up or down when deemed appropriate. Players above the cutoff point were marked as successful, while those below were marked as unsuccessful. A sample cutoff point for RBs can be seen to the right.
For players who have not yet completed four seasons in the NFL, the performance from their first few seasons was used to project AV over four years. Rookies drafted in 2020 were excluded from the dataset, as one season was not determined to be a sufficient sample size for projection. This binary success was then used as the response variable in a machine-learning model. The predicted probability that a player would fall in the success category (1) was used as their score to be scaled 0-100 within their position.
Combine Testing Metrics
AV was scraped from pro-football-reference.com and Combine/pro day results were kindly provided by draftscout.com. The dataset includes every player who was drafted from 2012-20 as well as the top 362 players in the 2021 NFL draft class as determined by expandtheboxscore.com. For a player to be ranked or used in the training set, they had to have completed at least four of the eight testing metrics.
The eight testing metrics used were bench, shuttle, 3-cone, vertical jump, broad jump, 10-yard split, 20-yard split, and 40-yard split. Players who did not have measurements in at least four of these areas were removed from the dataset. Along with these testing metrics, physical measurements of height, weight, wingspan, arm length and hand size were also used as predictors.
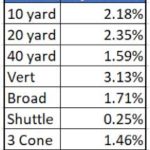 This season added another challenging element, as the cancellation of the Combine left only pro day results to be evaluated. To adjust for potentially skewed pro day results, the average difference in pro day and Combine results between players who participated in both from 2012-20 was calculated. Then, the pro day results were adjusted by these percentages to approximate how each player would have performed at the Combine.
The adjustment factors can be seen in the table to the right. The adjustment for the bench press was especially large due to the large percentile change that can result from one or two extra reps.
Many of the players in the dataset completed enough events to qualify but were still missing either physical or testing measures. These players were compared to past players with similar body types and testing numbers using machine learning to estimate what their performance in these missing events would have been.
In addition to these measurements, several features that have shown to be predictive of performance were engineered from the data. These features are as follows:
- Speed Score: Adjusts 40-yard dash by player weight
- Burst Score: Combines vertical jump and broad jump scores and adjusts for weight
- Quickness Score: Combines shuttle, 3-cone and 10-yard split and adjusts for weight
- Catch Radius: Combines arm length, height, vertical jump, 3-cone, shuttle and 40 to approximate how far a player can extend to catch
- Body Mass Index: Ratio of height to weight
Accuracy and Measure Importance
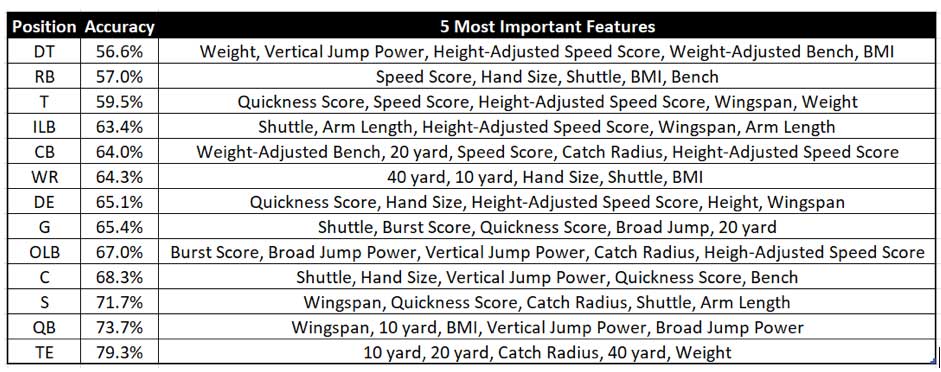
The accuracy varied between positions, with the lowest accuracy of a position group at 56.6% and the greatest accuracy achieved at 79.3%. The accuracy for each position and the most important features can be seen in the table below.
Results
Because ASI creates different models for each position, it can be challenging to concretely compare players between positions. Thus, the likelihood of success is scaled 0-100 within each position group to show how each player stacks up athletically with past players drafted. ASI is by no means a perfect metric for predicting success in the NFL, but rather a useful tiebreaker between players at the same position who are similarly graded by the scouting department.
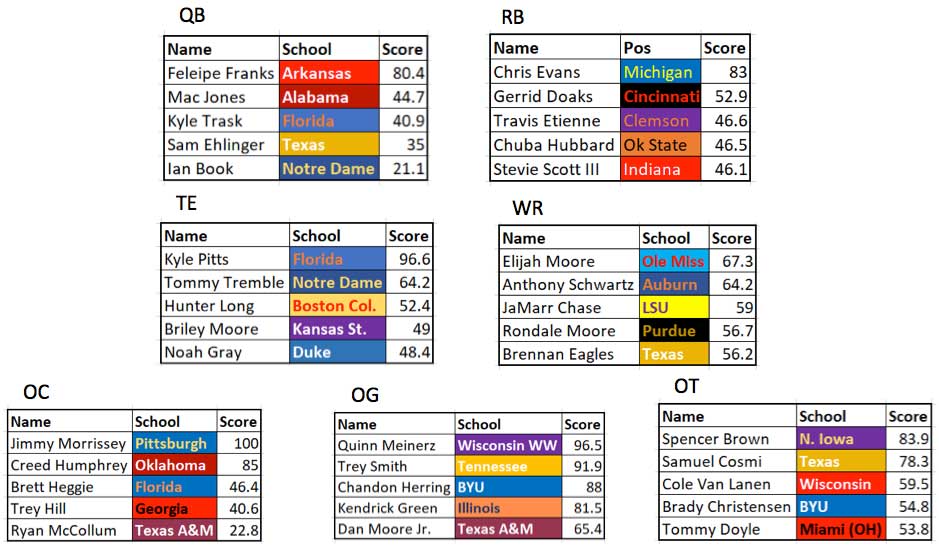
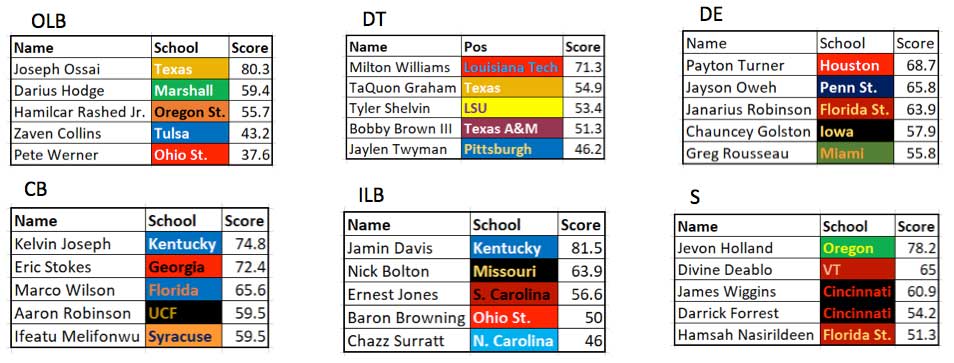
Below are the top 5 performing players at each position followed by a list of the players who did not participate in enough pro day events to be properly ranked by ASI.
Offense:
Defense:
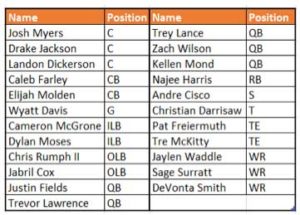
Notable players that did not qualify:
Summary & Future Research
ASI can be a useful tiebreaker for similarly graded prospects and the accuracy results show that athletic measurements do correlate with NFL success. Due to the nature of the metric, the players with the fastest times or “best” measurements may not always come out on top if their measurables are not as similar to those who have had past NFL success. Going forward, the model could be improved by adding the data of undrafted players and accuracy will continue to increase as more prospects are added to the database. Establishing minimum baselines for measurements based on ASI would be another project to explore in the future. It will be interesting to see how these top performers pan out at the NFL level.