Analysis
7/13/22
8 min read
The State of NFL Free Agency – Part 4
Story by Jamie Kelly
Back in Part 1 of this series, we ran over the rationale for this study of high-profile NFL Free Agent transactions between 2015-2019, the methodology that was used, and then through Part 3 we presented the position-by-position results.
In this final part of this study, we’ll be looking at the study results from a team perspective. Which teams do a better job of identifying talent in Free Agency? Which teams cut ties at just the right time?
To help us do this, we’ll tackle this from the two sides of the coin: from the leaving team’s perspective (i.e., the last team the player played for before hitting FA), and the acquiring team’s perspective. We’ll continue to assess pre-FA and post-FA performance using the two key metrics used throughout this study: Yearly AV Comparison (between pre- and post-FA), and Yearly AV vs. $ Expectation. For more on how these metrics, revisit part 1 for a full explanation.
The Leaving Team
Here we breakdown all the transactions by our two metrics. In Yearly AV comparison, a positive result would indicate players improve after leaving the marked team in FA. In yearly AV vs. Expectation, positive results would indicate that when players leave the team, they exceed the expectation of their contract value. All team numbers are the pure average.
Here’s the complete charting of results:
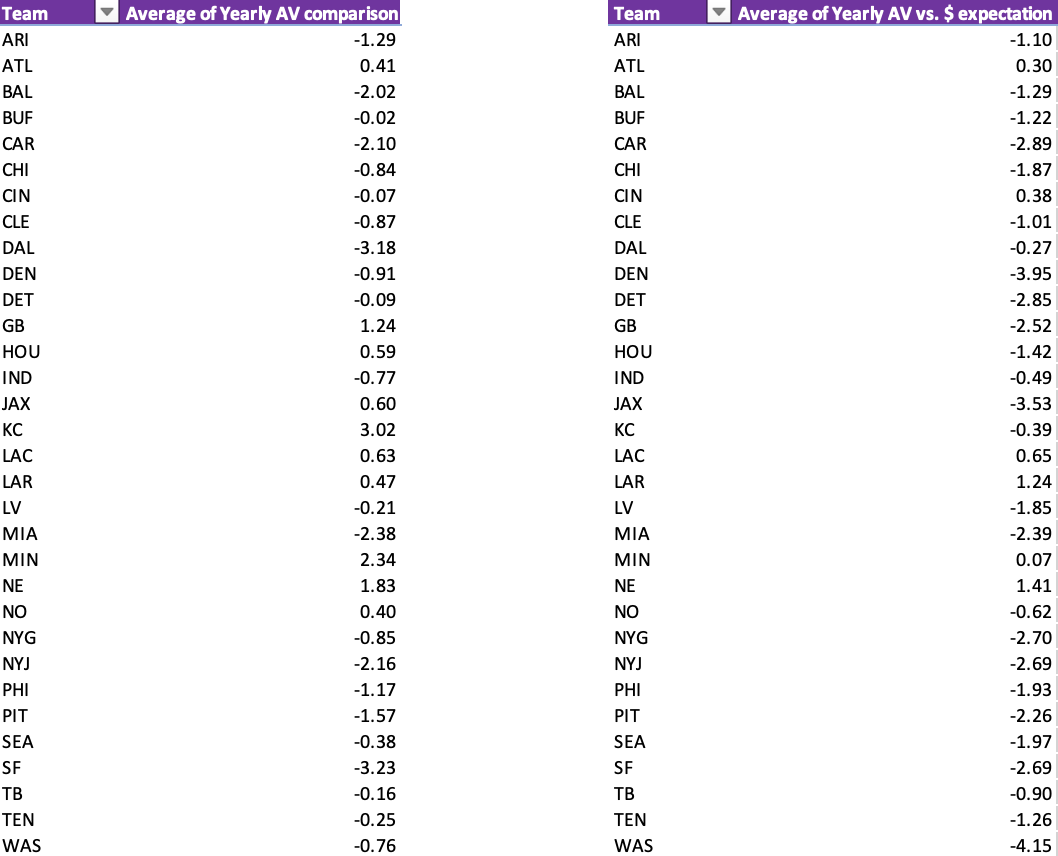
The Top 2 Teams, by Yearly AV vs Comparison
For clarity, we’re grading a team’s ability here to extract value from players before-FA, but then not to fall into the mistake of paying for sub-par, post-FA performances. While there’s a wide array of factors that go into performance post-FA, we’re going just by the pure numbers here in the rankings.
- Chicago Bears: -3.28
Josh Sitton (-9.73) and Matt Forte (-6.43), two aging, high-performing veterans are a large reason for this number. QB Josh McCown (-0.73), DT Stephen Paea (-1.65) and CB Bryce Callahan (-1.30) also saw declines in Yearly AV after leaving Chicago. The only player with a positive yearly AV (so therefore improved after leaving) was Adrian Amos (0.14).
- Atlanta Falcons: -2.36
RB Tevin Coleman (-5.04) and CB Robert Alford (-4.46) both failed to deliver in SF and ARI respectively after leaving Atlanta. WR Taylor Gabriel (0.01) was the only one of the five transactions that earned a positive grade. DE Adrian Clayborn (-1.63) and FB Patrick DiMarco (-0.68) were the other two transactions.
The Worst 2 Teams, by Yearly AV vs Comparison
In contrast to the above, we’re looking for the highest positive scores per team, to highlight teams that failed to extract performance out of players that would go onto succeed elsewhere post-FA.
- Arizona Cardinals: 2.33
All four players included within this study that left ARI, improved with another team. These included: DT Calais Campbell (4.30), S DJ Swearinger (2.44), S Tony Jefferson (1.37), and OT Bobby Massie (1.20)
- Buffalo Bills: 1.40
Across the 8 transactions included in this study, Buffalo saw great variety. While letting DE Mario Williams (-5.80) leave was a sensible decision. The transactions that saw CB Stephon Gilmore (7.02), WR Robert Woods (4.88), WR Chris Hogan (2.98), and S Da’Norris Searcy (2.26) don’t look quite so pretty in hindsight.
The Best 2 Teams, by Yearly AV vs $$$ Expectation
Here, we’ll be ranking teams by the Yearly AV vs. $$$ comparison metric that looks at the level of performance we should expect from a player given his contract value. Negative scores (which would mean the leaving team did well letting the player go) indicate a poor return on investment for the acquiring team. With the best ranked teams, these are the teams that avoided the potentially costliest mistakes.
- Tampa Bay Buccaneers: -3.46
The exception here was Ryan Fitzpatrick who turned into a good pick-up for MIA (4.88), but the other three players who left TB: QB Mike Glennon (-7.87), LB Kwon Alexander (-6.47), and WR Adam Humphries (-4.39), failed to live up to their lofty free agent contracts.
- Los Angeles Rams: -3.38
7 of the 8 players that left LAR in Free Agency, ended up under-performing against their contract. These included: Trumaine Johnson (-8.74), CB Janoris Jenkins (-3.80), WR Sammy Watkins (-3.74) and LaMarcus Joyner (-7.56), with LB Mark Barron (1.05) the only positive grader in value terms.
The Worst 2 Teams, by Yearly AV vs $$$ Expectation
This ranking focuses on the teams that let good value players slip from their organization via Free Agency.
- Cleveland Browns: 0.32
The two big misses for CLE in Free Agency was letting OC Alex Mack (3.83) and OT Mitchell Schwartz (9.12) leave the building for value deals. Elsewhere they performed around average, with a deal to let TE Jordan Cameron (-6.20) leave for MIA, one particularly good one in hindsight.
- Buffalo Bills: 0.14
While covered above when discussing Yearly AV comparison, it should be highlighted that Buffalo missed some good opportunities for value with WR Robert Woods (5.13) and WR Chris Hogan (2.61) who both excelled at low-contract values elsewhere post-FA.
The Acquiring Team
As with the leaving team results, the following are pure averages of all transactions involving the acquiring team. While with the leaving teams negative scores equaled a good result, for the acquiring team we want to see positive results across our two metrics.
Here’s the complete charting of results:
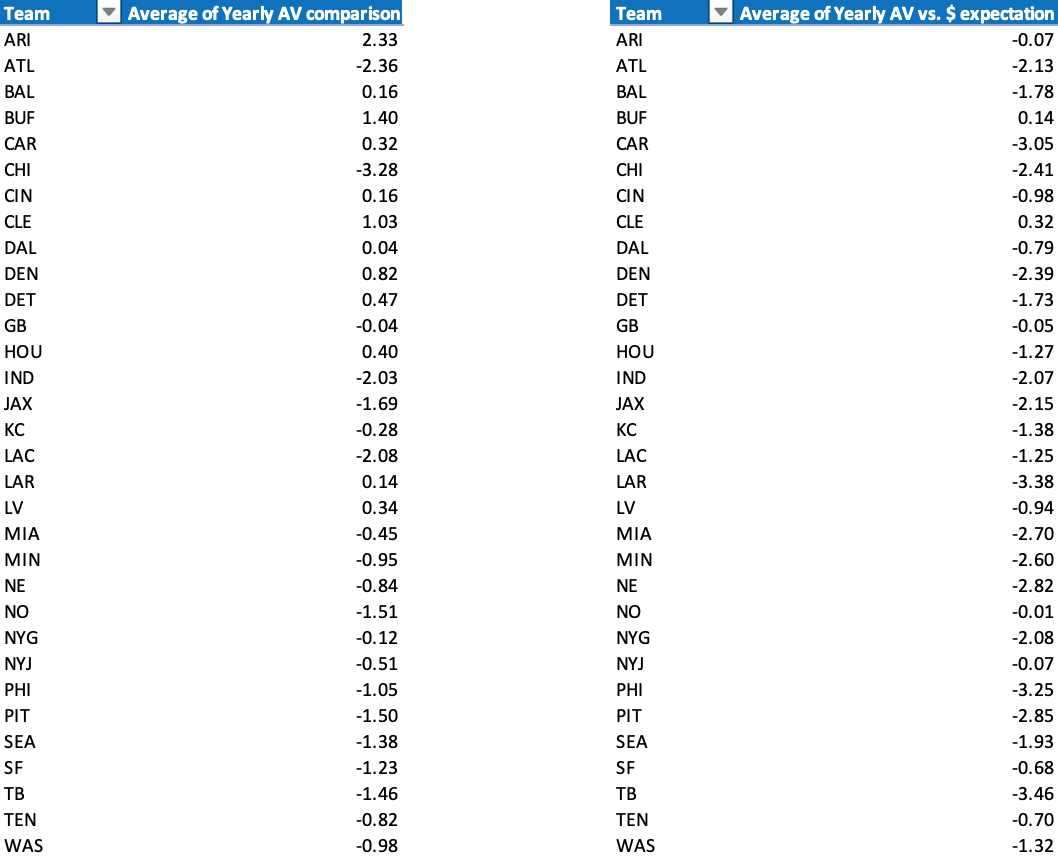
The Top 2 Teams, by Yearly AV vs Comparison
- Kansas City Chiefs: 3.02
All five of KC’s FA transactions, included within this study, produced a higher yearly AV output than they did before FA. The group was highlighted by notable successes OT Mitchell Schwartz (8.58) and S Tyrann Mathieu (4.19).
- Minnesota Vikings: 2.34
All six of Minnesota’s transactions received a yearly AV improvement once they got to MIN. QB Kirk Cousins (5.68) is the highlight of the group, with IDL Shemar Stephens (2.88) and OT Mike Remmers (2.88) both making solid improvements post signing with the Vikings.
The Worst 2 Teams, by Yearly AV vs Comparison
- San Francisco 49ers: -3.23
It’s an indictment of the SF FA process in 2015-2019, when only one of the eleven FA transactions made in this period had a positive yearly AV grade (Kyle Juszczyk at 1.94). Notable misses include: WR Torrey Smith (-4.42), RB Jerick McKinnon (-6.57), and RB Tevin Coleman (-5.04).
- Dallas Cowboys: -3.18
Dallas only made two qualifying transactions in this study period, but both IDL Cedric Thornton (-3.07), and RB Alfred Morris (-3.29) took significant step backs after arriving in Dallas.
The Top 2 Teams, by Yearly AV vs $$$ Expectation
- New England Patriots: 1.41
Should come as no surprise to see that New England did an excellent job at acquiring ‘value’ free agents during this period. Only one of the seven transactions (Adrian Clayborn at -1.54) failed to deliver a positive yearly AV vs. $ expectation. The acquisitions of IDL Lawrence Guy (6.27) and WR Chris Hogan (2.61) stand out as significant successes for the Patriots.
- Los Angeles Chargers: 0.65
Deals for TE Virgil Green (-2.52) and OT Russell Okung (-4.14) didn’t deliver quite as hoped, but in the aggregate the Chargers netted out as one of the best acquirers by yearly AV vs. $ expectation. CB Casey Heyward (8.19) was one of the best value signings in the entire study, with OC Mike Pouncey (4.69), and Brandon Mebane (1.63) also representing good business.
The Worst 2 Teams, by Yearly AV vs $$$ Expectation
- Washington Commanders -4.15
DJ Swearinger (1.54) represents a lone bright spot in Washington’s Free Agent acquisitions. S Landon Collins (-11.09), WR Paul Richardson (-4.12), CB Chris Culliver (-4.75), and CB Josh Norman (-7.92) were all high-priced disappointing acquisitions.
- Denver Broncos: -3.95
All of Denver’s seven free agent acquisitions failed to bring a positive yearly AV vs. $ expectation grade. OT Ju’Wuan James (-10.22) was the notable negative scorer but players such as CB Bryce Callahan (-3.58), CB Kareem Jackson (-3.29), and OG Ronald Leary (-3.57) show consistent overpayment of talent.
Conclusion
While positives and negatives can be built from this study, we can best surmise Free Agency as a roulette table that’s weighted in the favor of the casino. While winning big is possible, the odds are not in the favor of the acquiring team. To illustrate this one final time, we averaged our two key metrics across every transaction included in this study resulting in an outcome of:
Average Yearly AV Comparison: -0.46
Average Yearly AV vs. $ expectation: -1.63
When a new signing is made via Free Agency, we can freely say this player or that player is the ‘final piece of the puzzle’ all we like but the numbers don’t lie - Free Agency is an odds-against marketplace.
In case you missed it, check out Part 1, Part 2, and Part 3, for the full study methodology and position-by-position breakdowns.